


Capacity decisions shouldn't wait for a dashboard refresh.
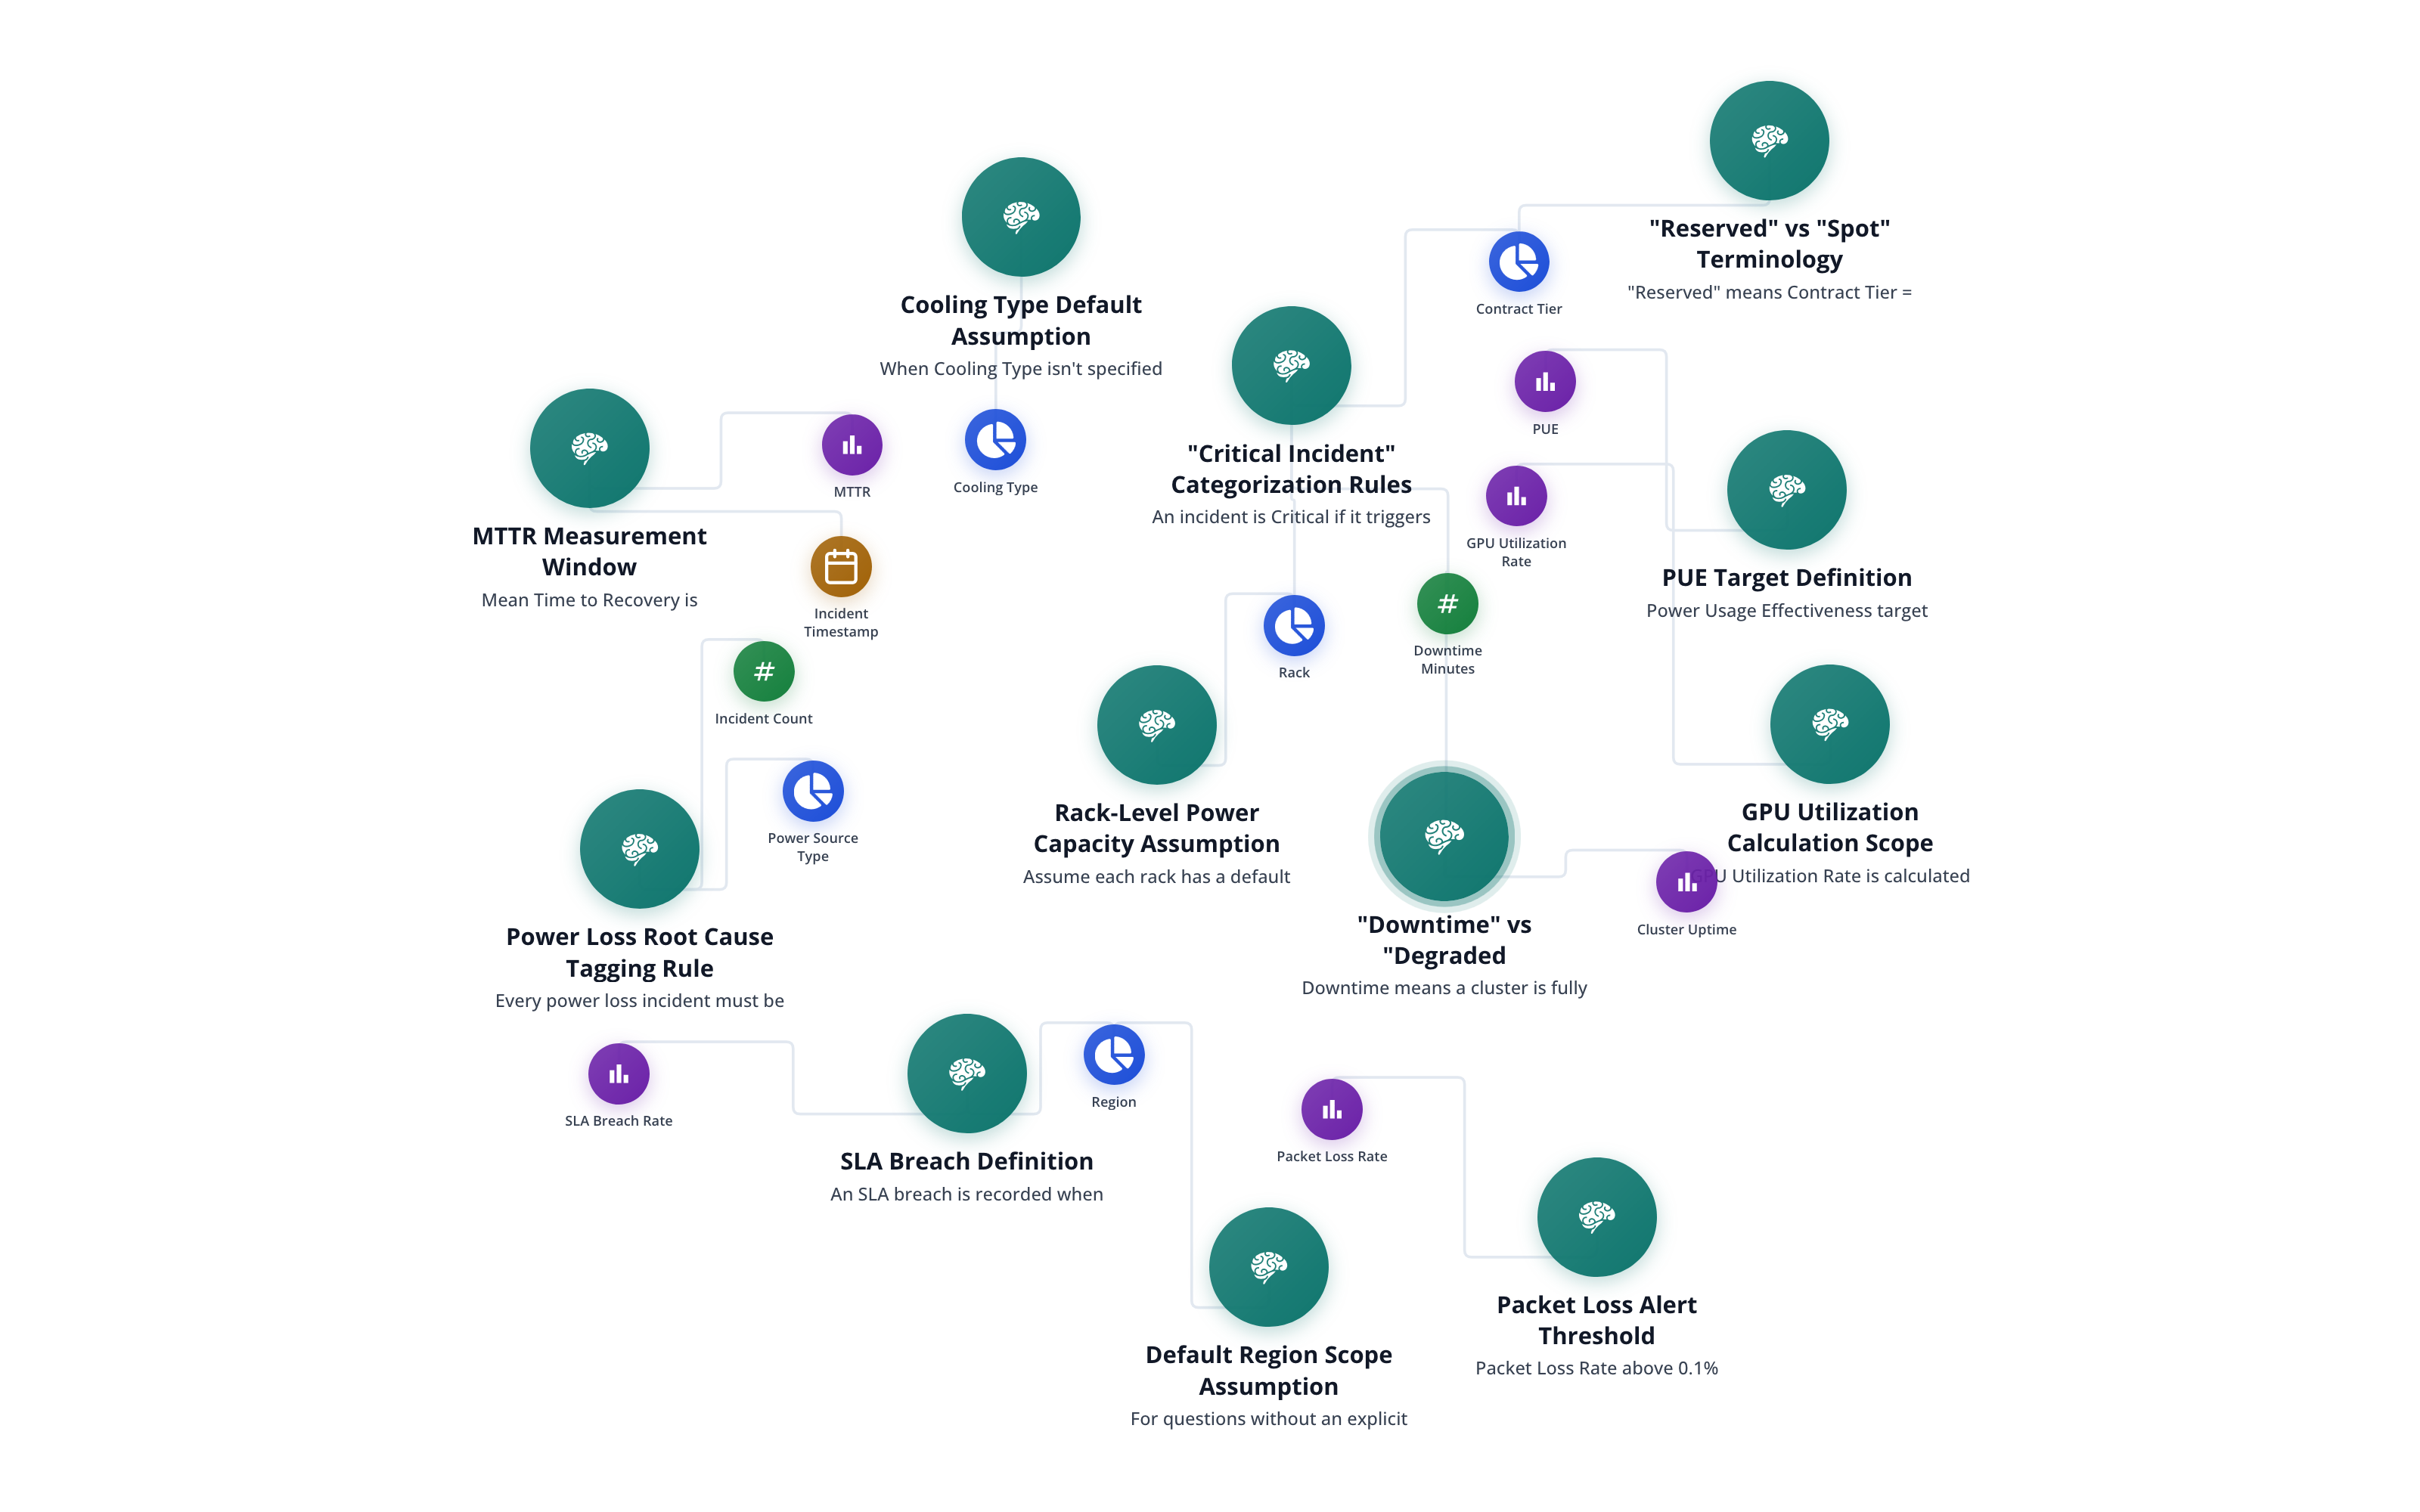
Your team manages the variables that determine unit economics at scale - utilization, cost per compute hour, regional allocation, workload efficiency. Anko puts an analyst on your infrastructure data so capacity, engineering, and finance teams get answers at the speed the business requires.
Request Demo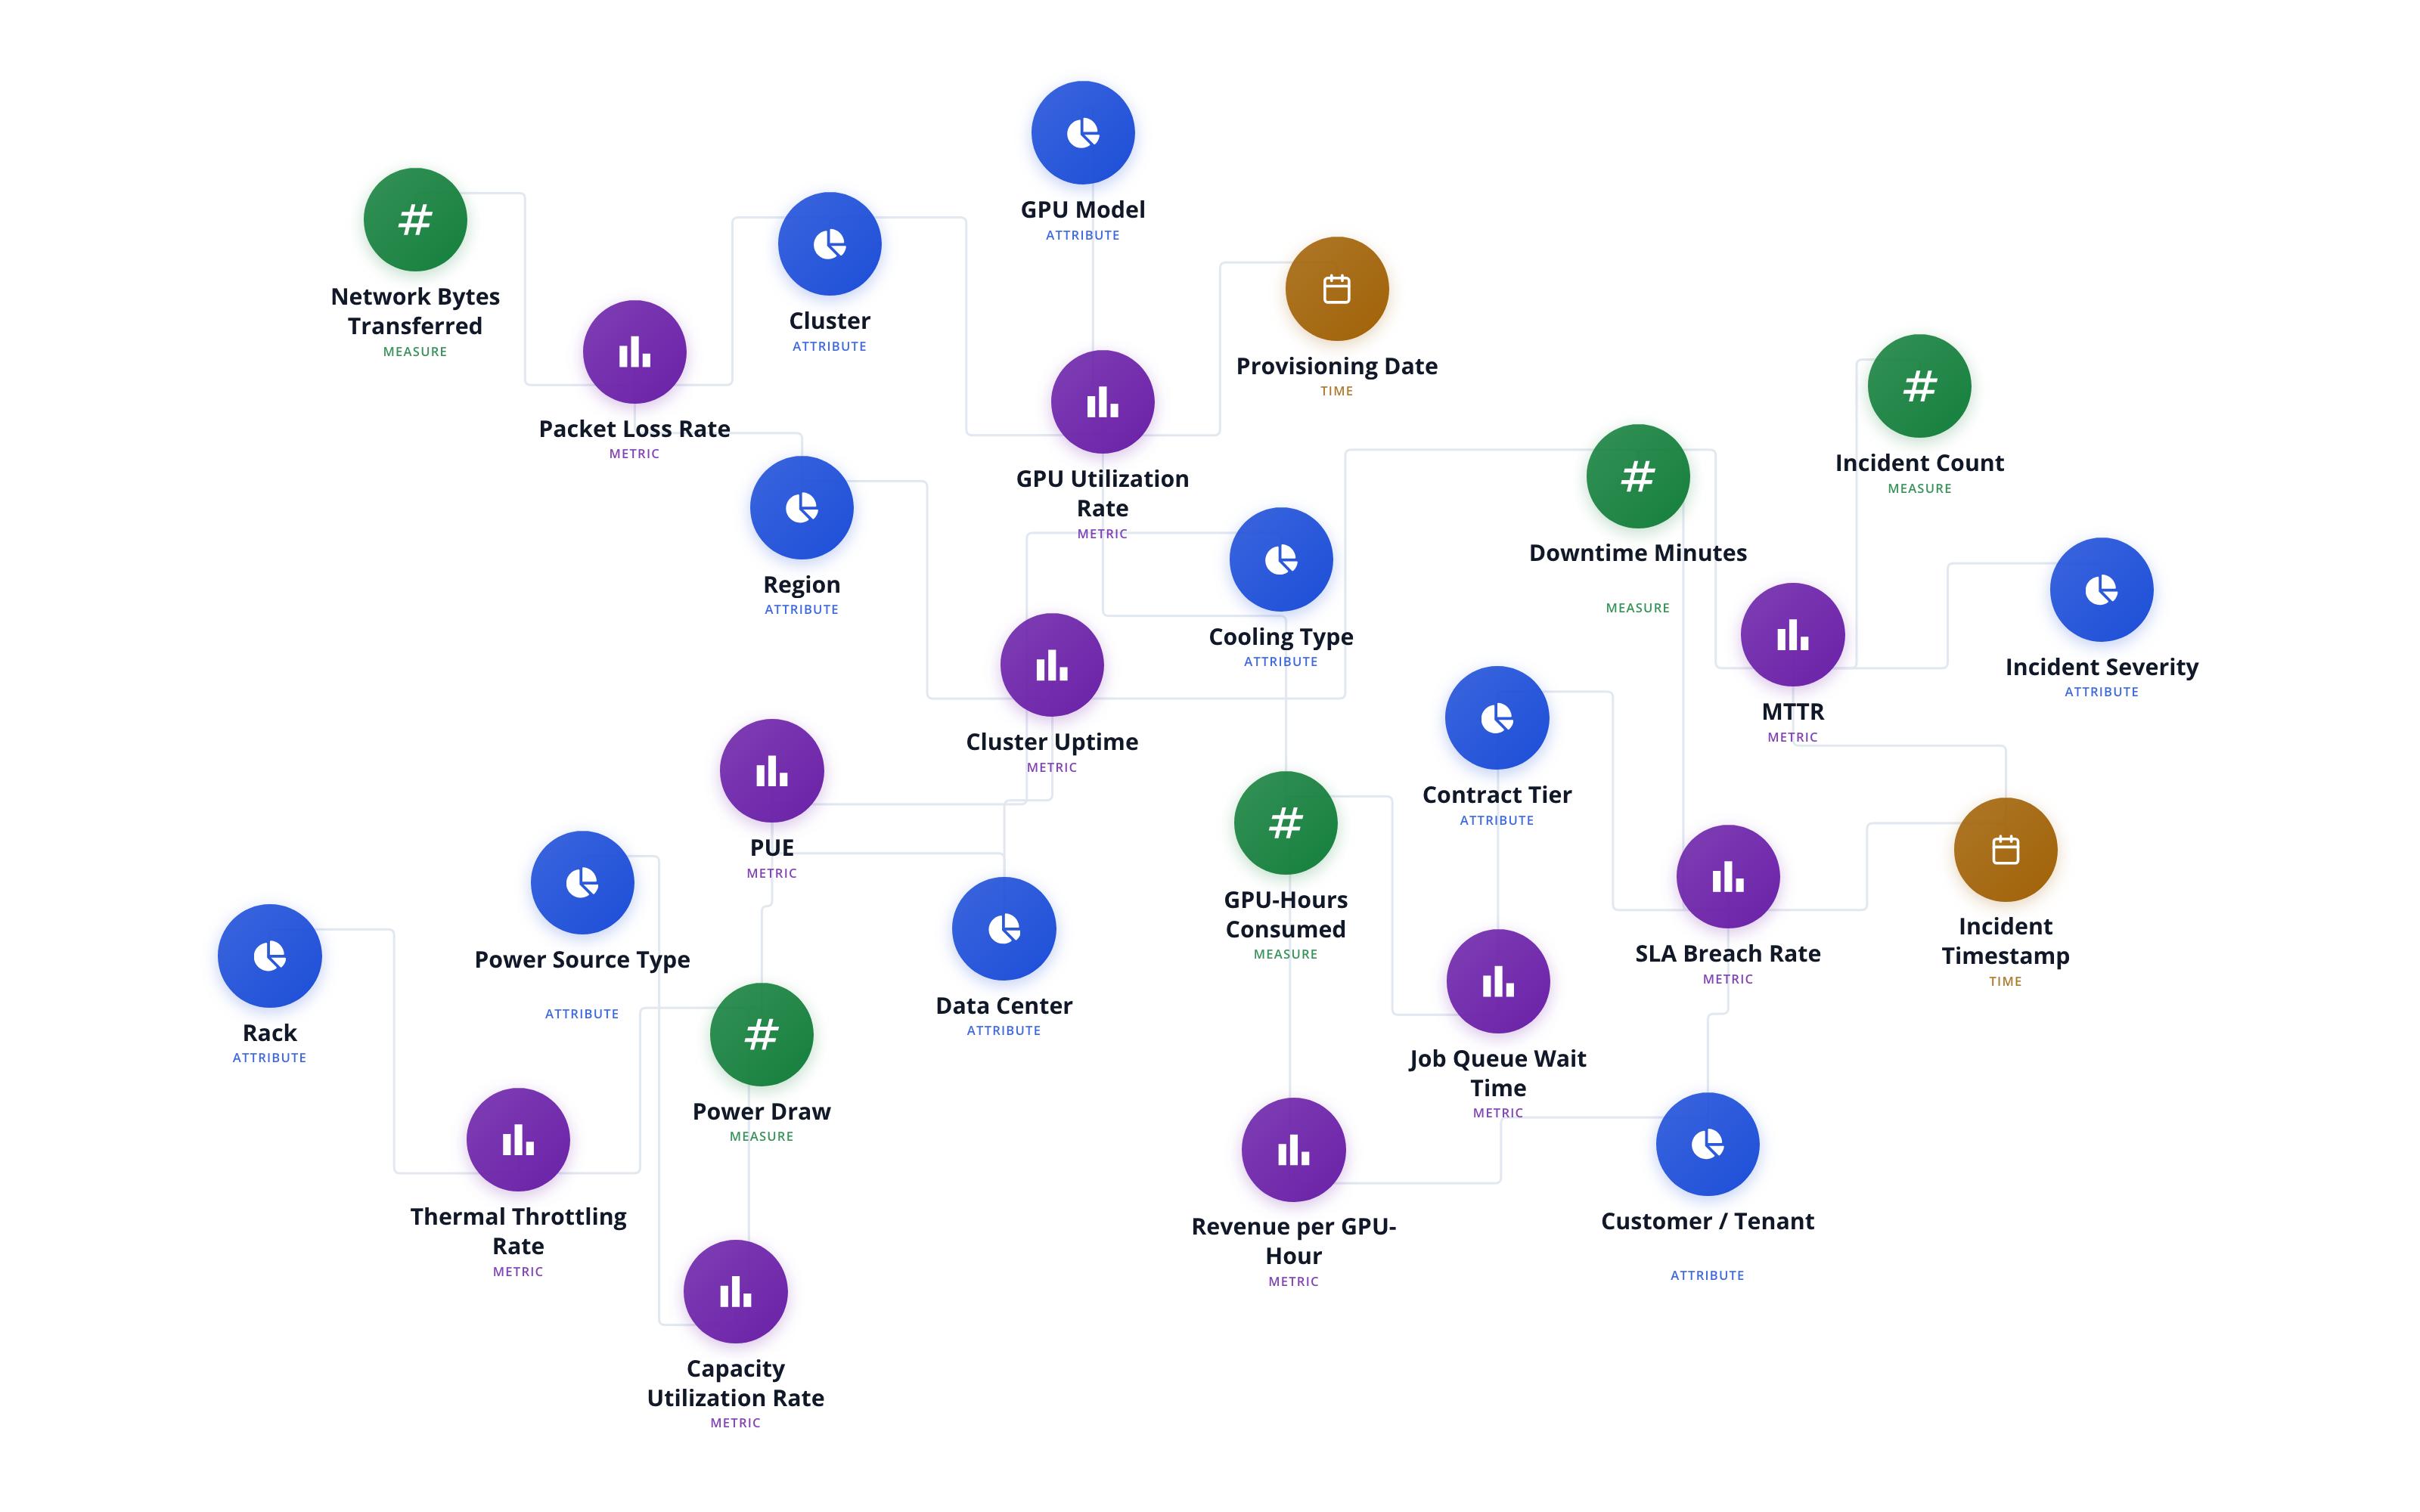
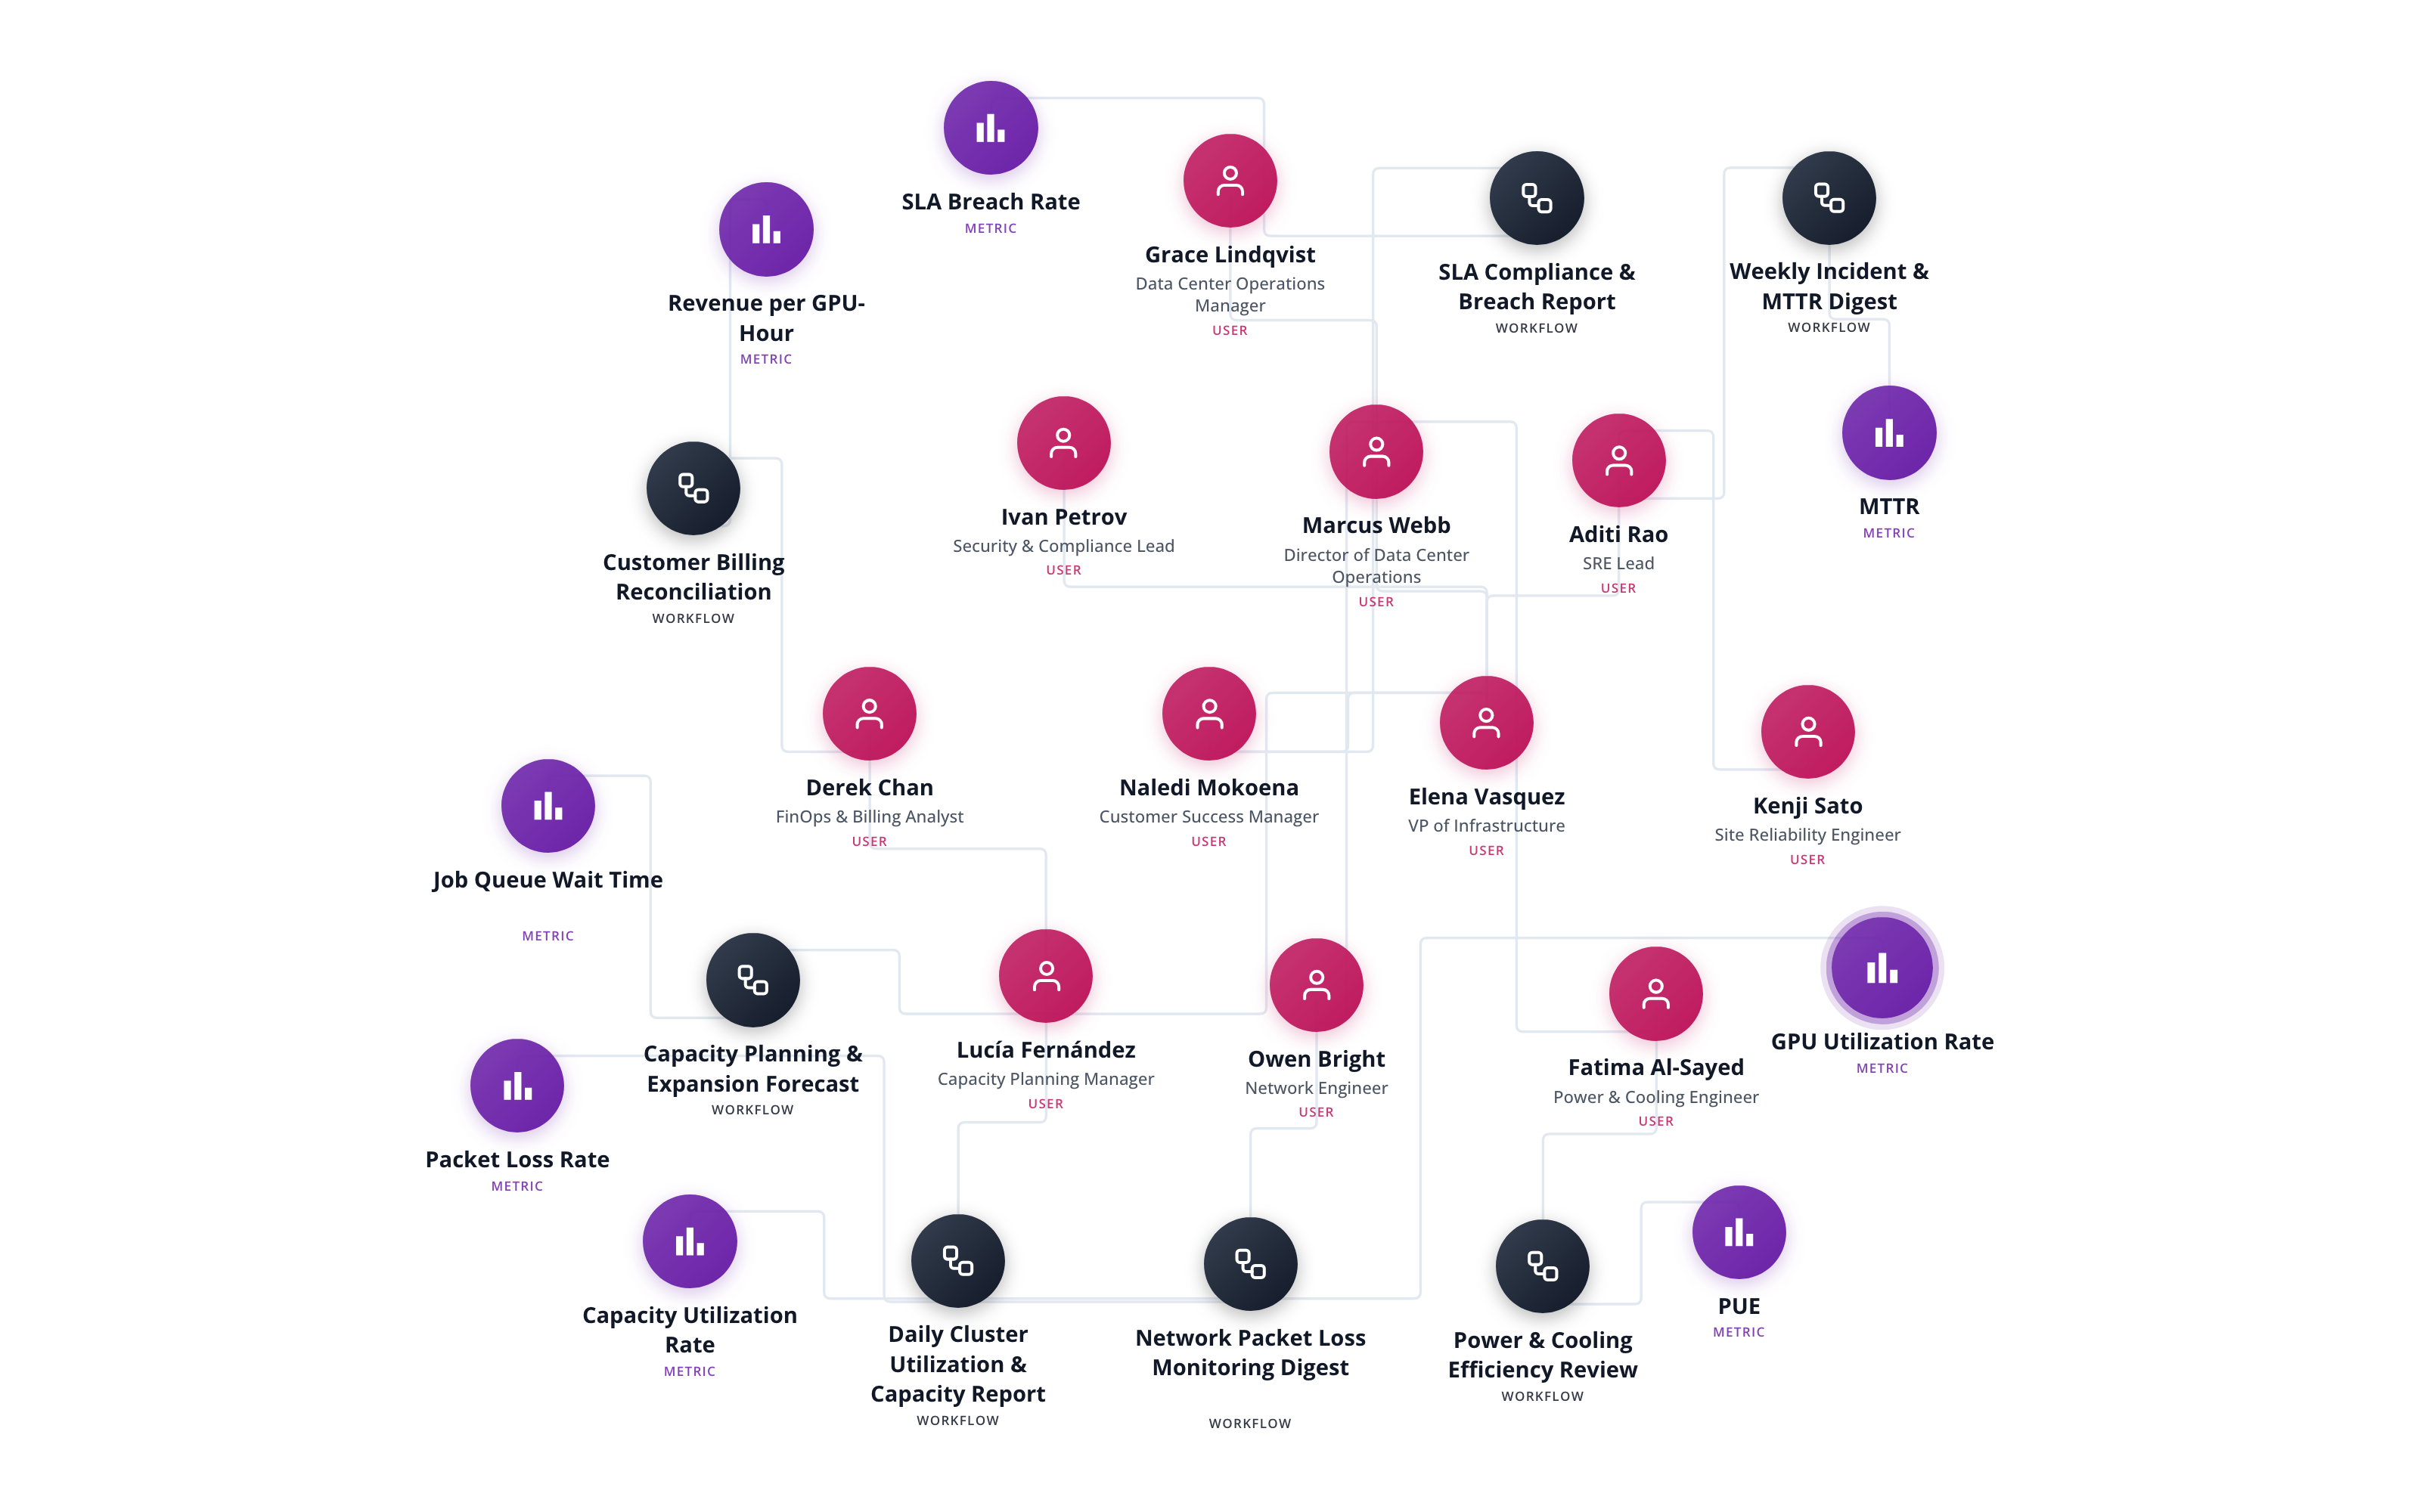
See utilization against capacity before it becomes an incident.
Running hot in a region ahead of a demand spike? Over-provisioned somewhere else? Anko monitors utilization against plan continuously and flags deviations early - so you're managing capacity proactively.
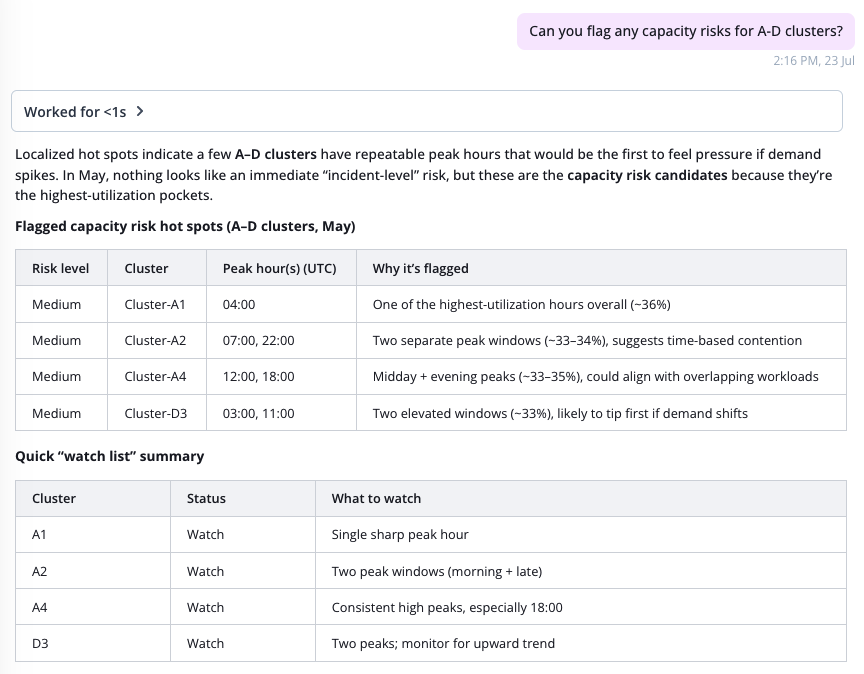
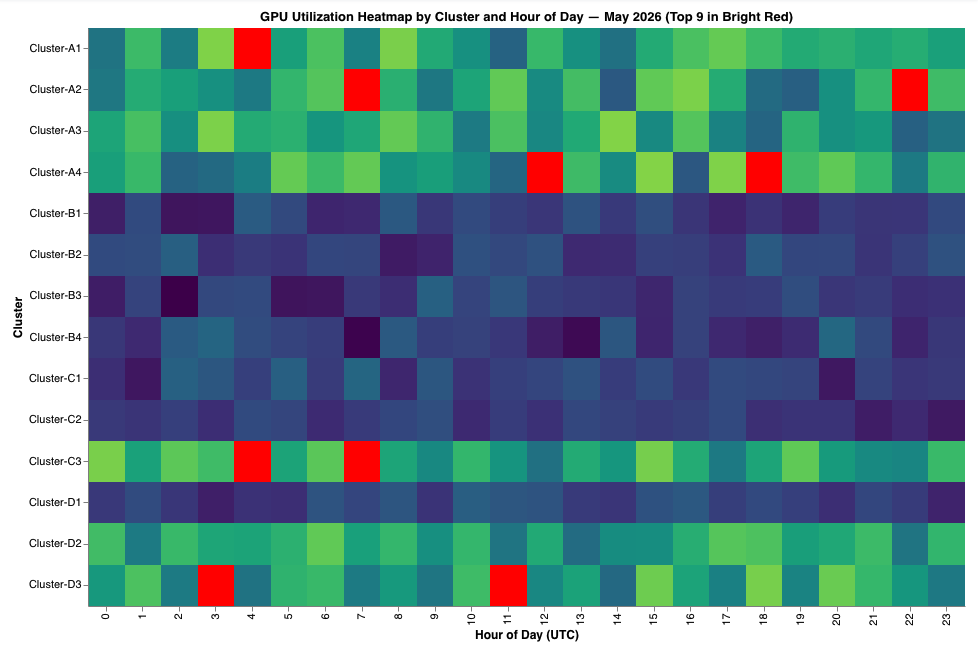
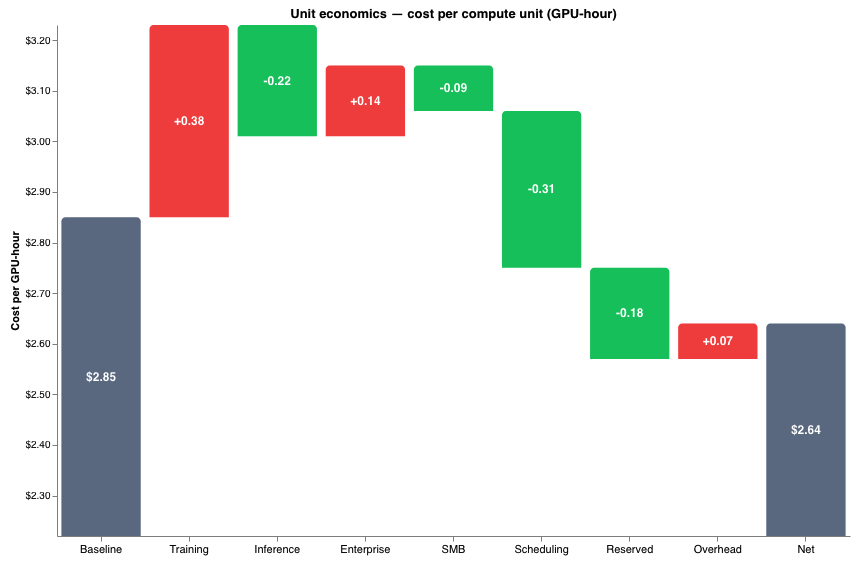
Break down cost per compute unit by every dimension that matters.
Cost per GPU hour, cost by workload type, cost by customer segment - Anko answers these on demand and keeps finance and engineering aligned on where efficiency is being gained or lost as the business scales.
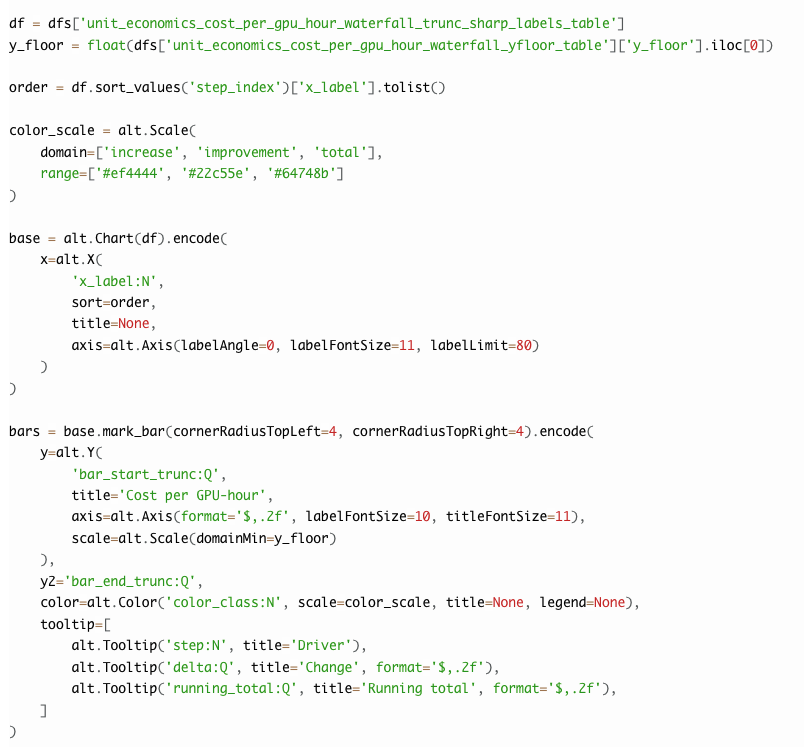
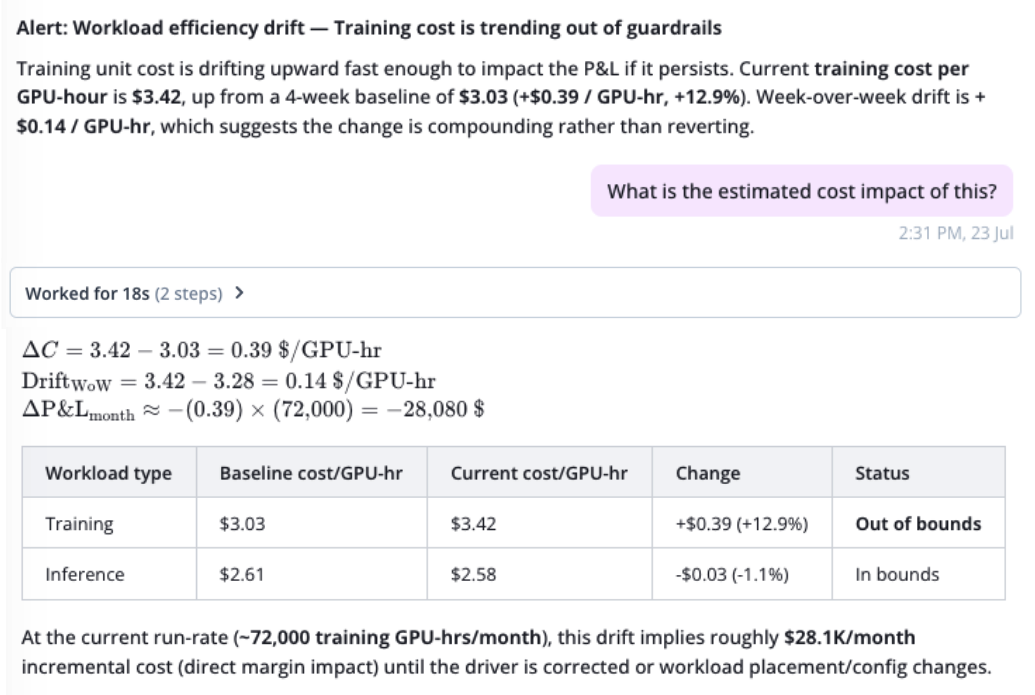
Catch workload efficiency drift before it hits the P&L.
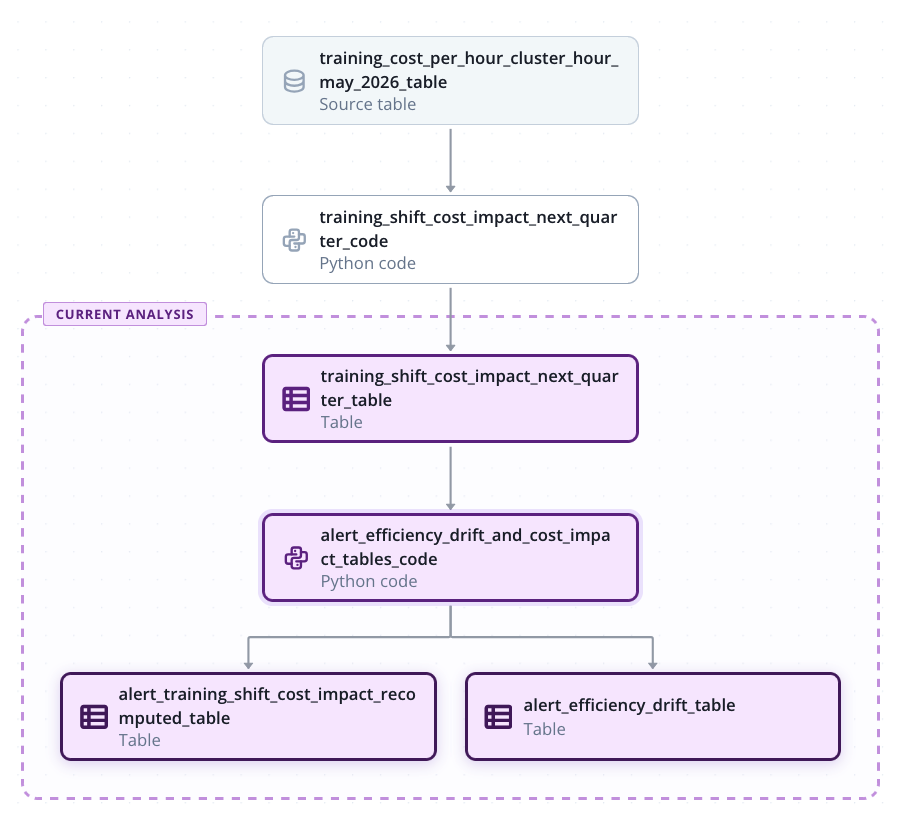
Some workloads get more expensive as they scale. Anko tracks efficiency trends by workload type and surfaces the ones drifting out of unit economics - early enough to investigate and intervene before margin is affected.
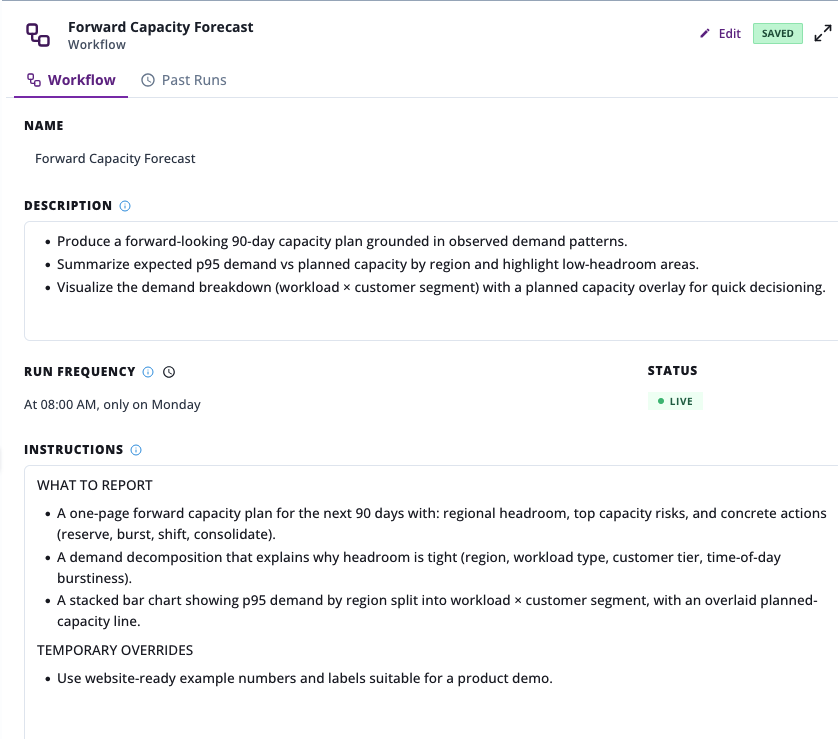
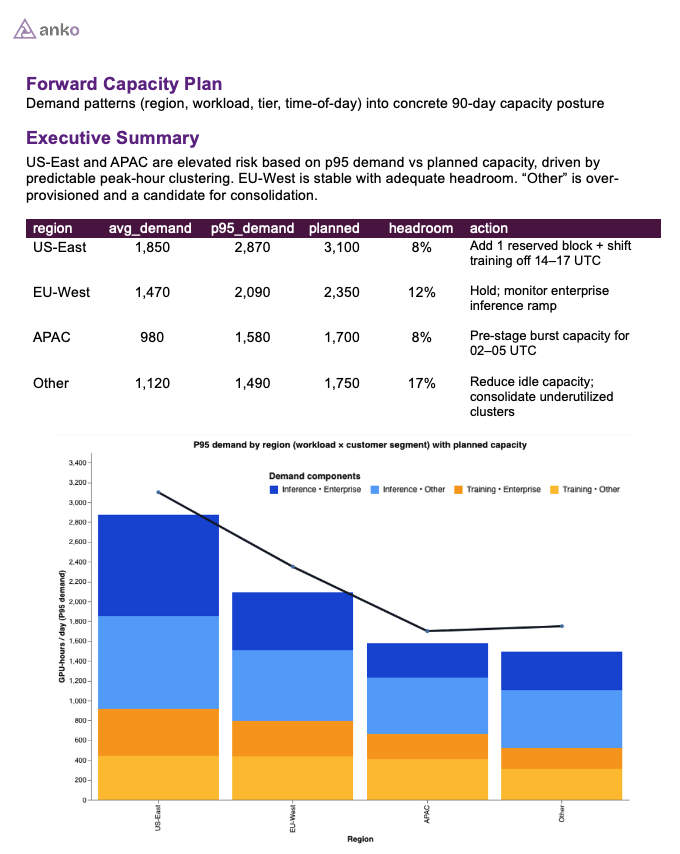
Build forward capacity plans grounded in how demand actually behaves.
Capacity planning built on headline utilization misses the patterns that matter. Anko builds the full demand picture - by region, workload type, customer tier, time of day - so infrastructure decisions aren't grounded in averages.