


Total clarity on pipeline. Confident calls on forecast.
Anko gives sales and revenue operators instant, accurate answers on pipeline, forecast, and rep performance, grounded in your CRM data. Coverage ratios, stage conversion, quota attainment - all a question away.
Request DemoMap the fastest path to your revenue target.
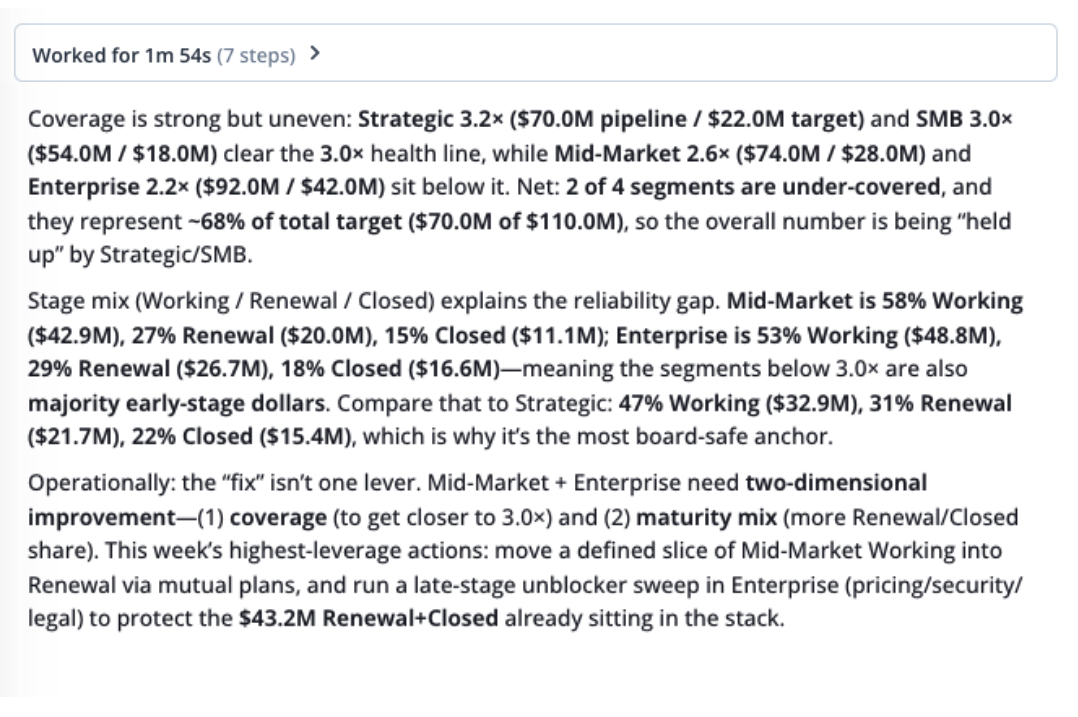
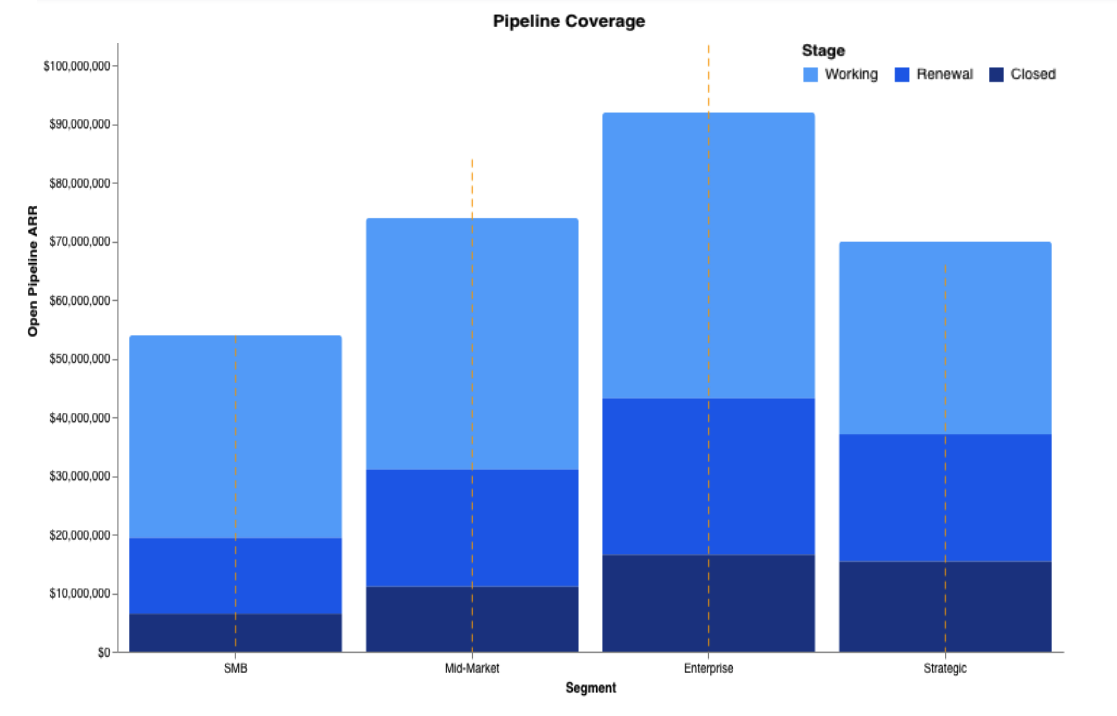
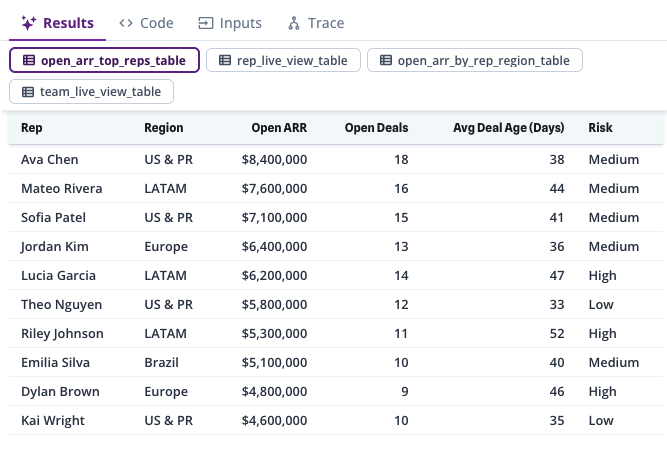
Pipeline coverage by segment, deal velocity by stage, open ARR by rep and region - Anko builds the full picture on demand. Know exactly what you need to close, where the risk is, and what to do about it.
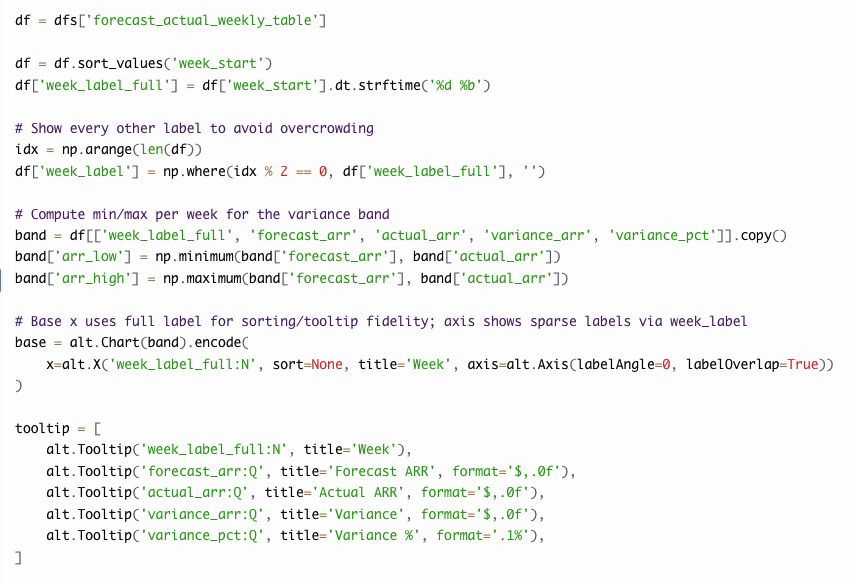
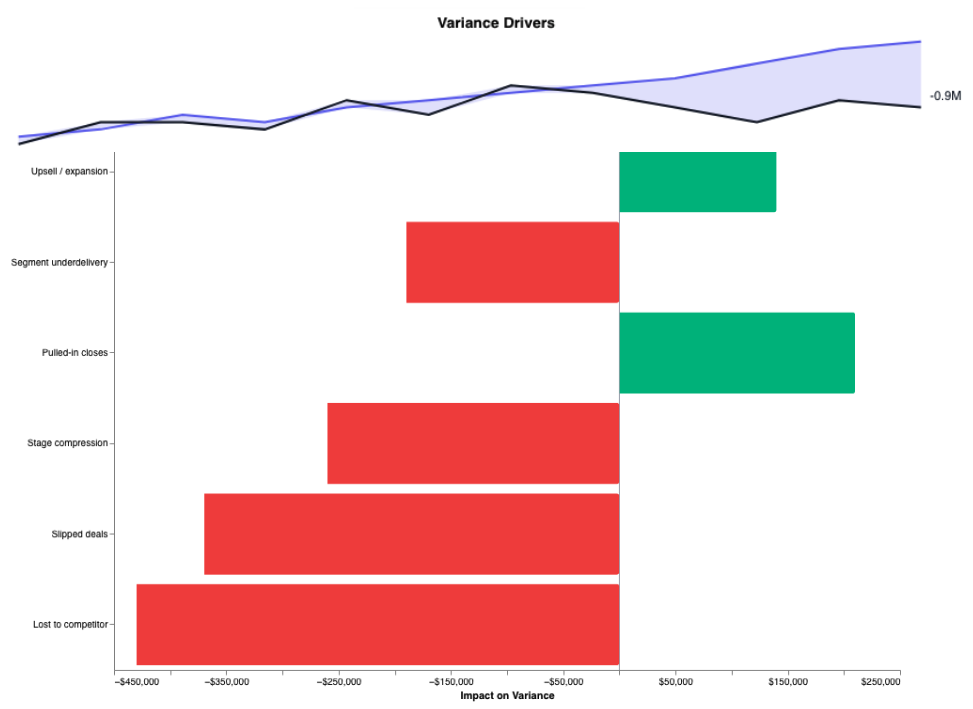
Understand forecast variance before the board asks.
When actuals miss plan, Anko traces the gap - which deals slipped, which stages compressed, which segments underdelivered. You get a narrative with line-item accountability.
Give every sales leader a live view of their team.
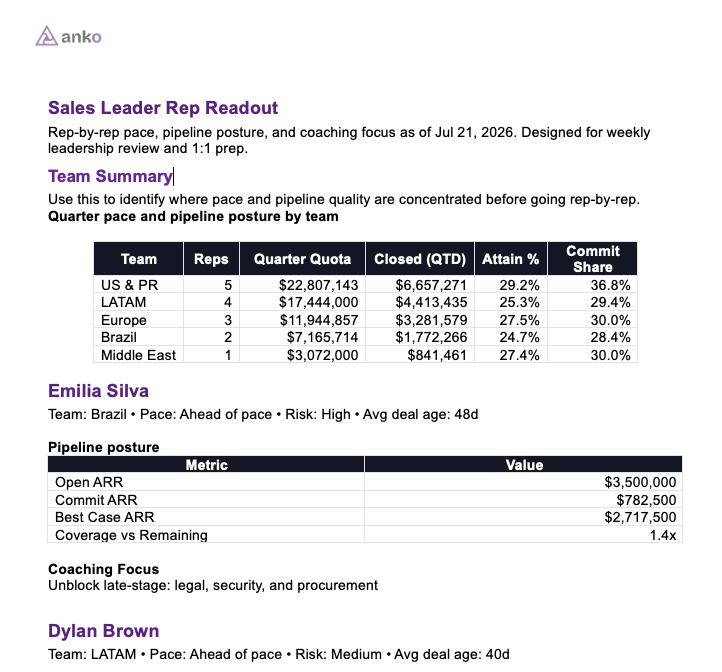
Who's ahead of pace, who's at risk, where to coach - answered at the rep, team, and segment level without a BI request. Anko makes rep performance as readable as pipeline.
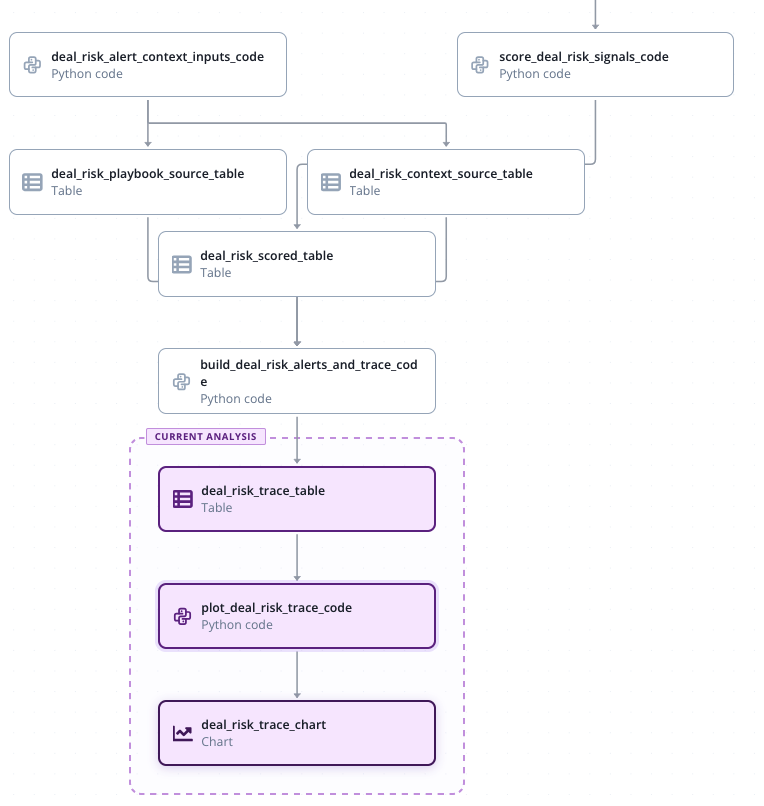
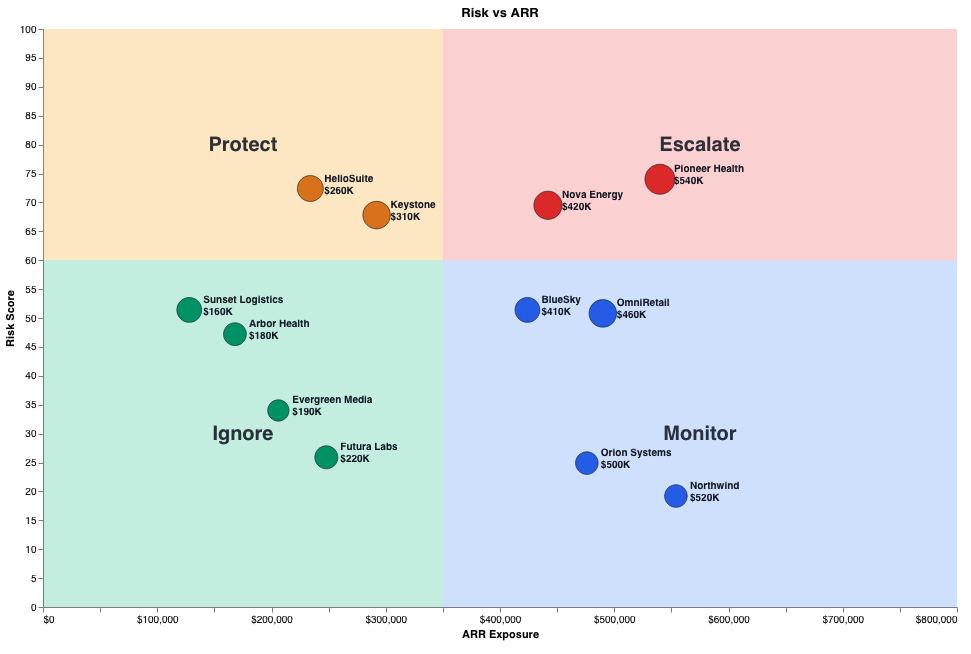
Surface deal risk before it becomes a slip.
Anko monitors stage velocity, engagement recency, and historical close patterns to flag at-risk deals early. Your team gets the alert with enough runway to act.