


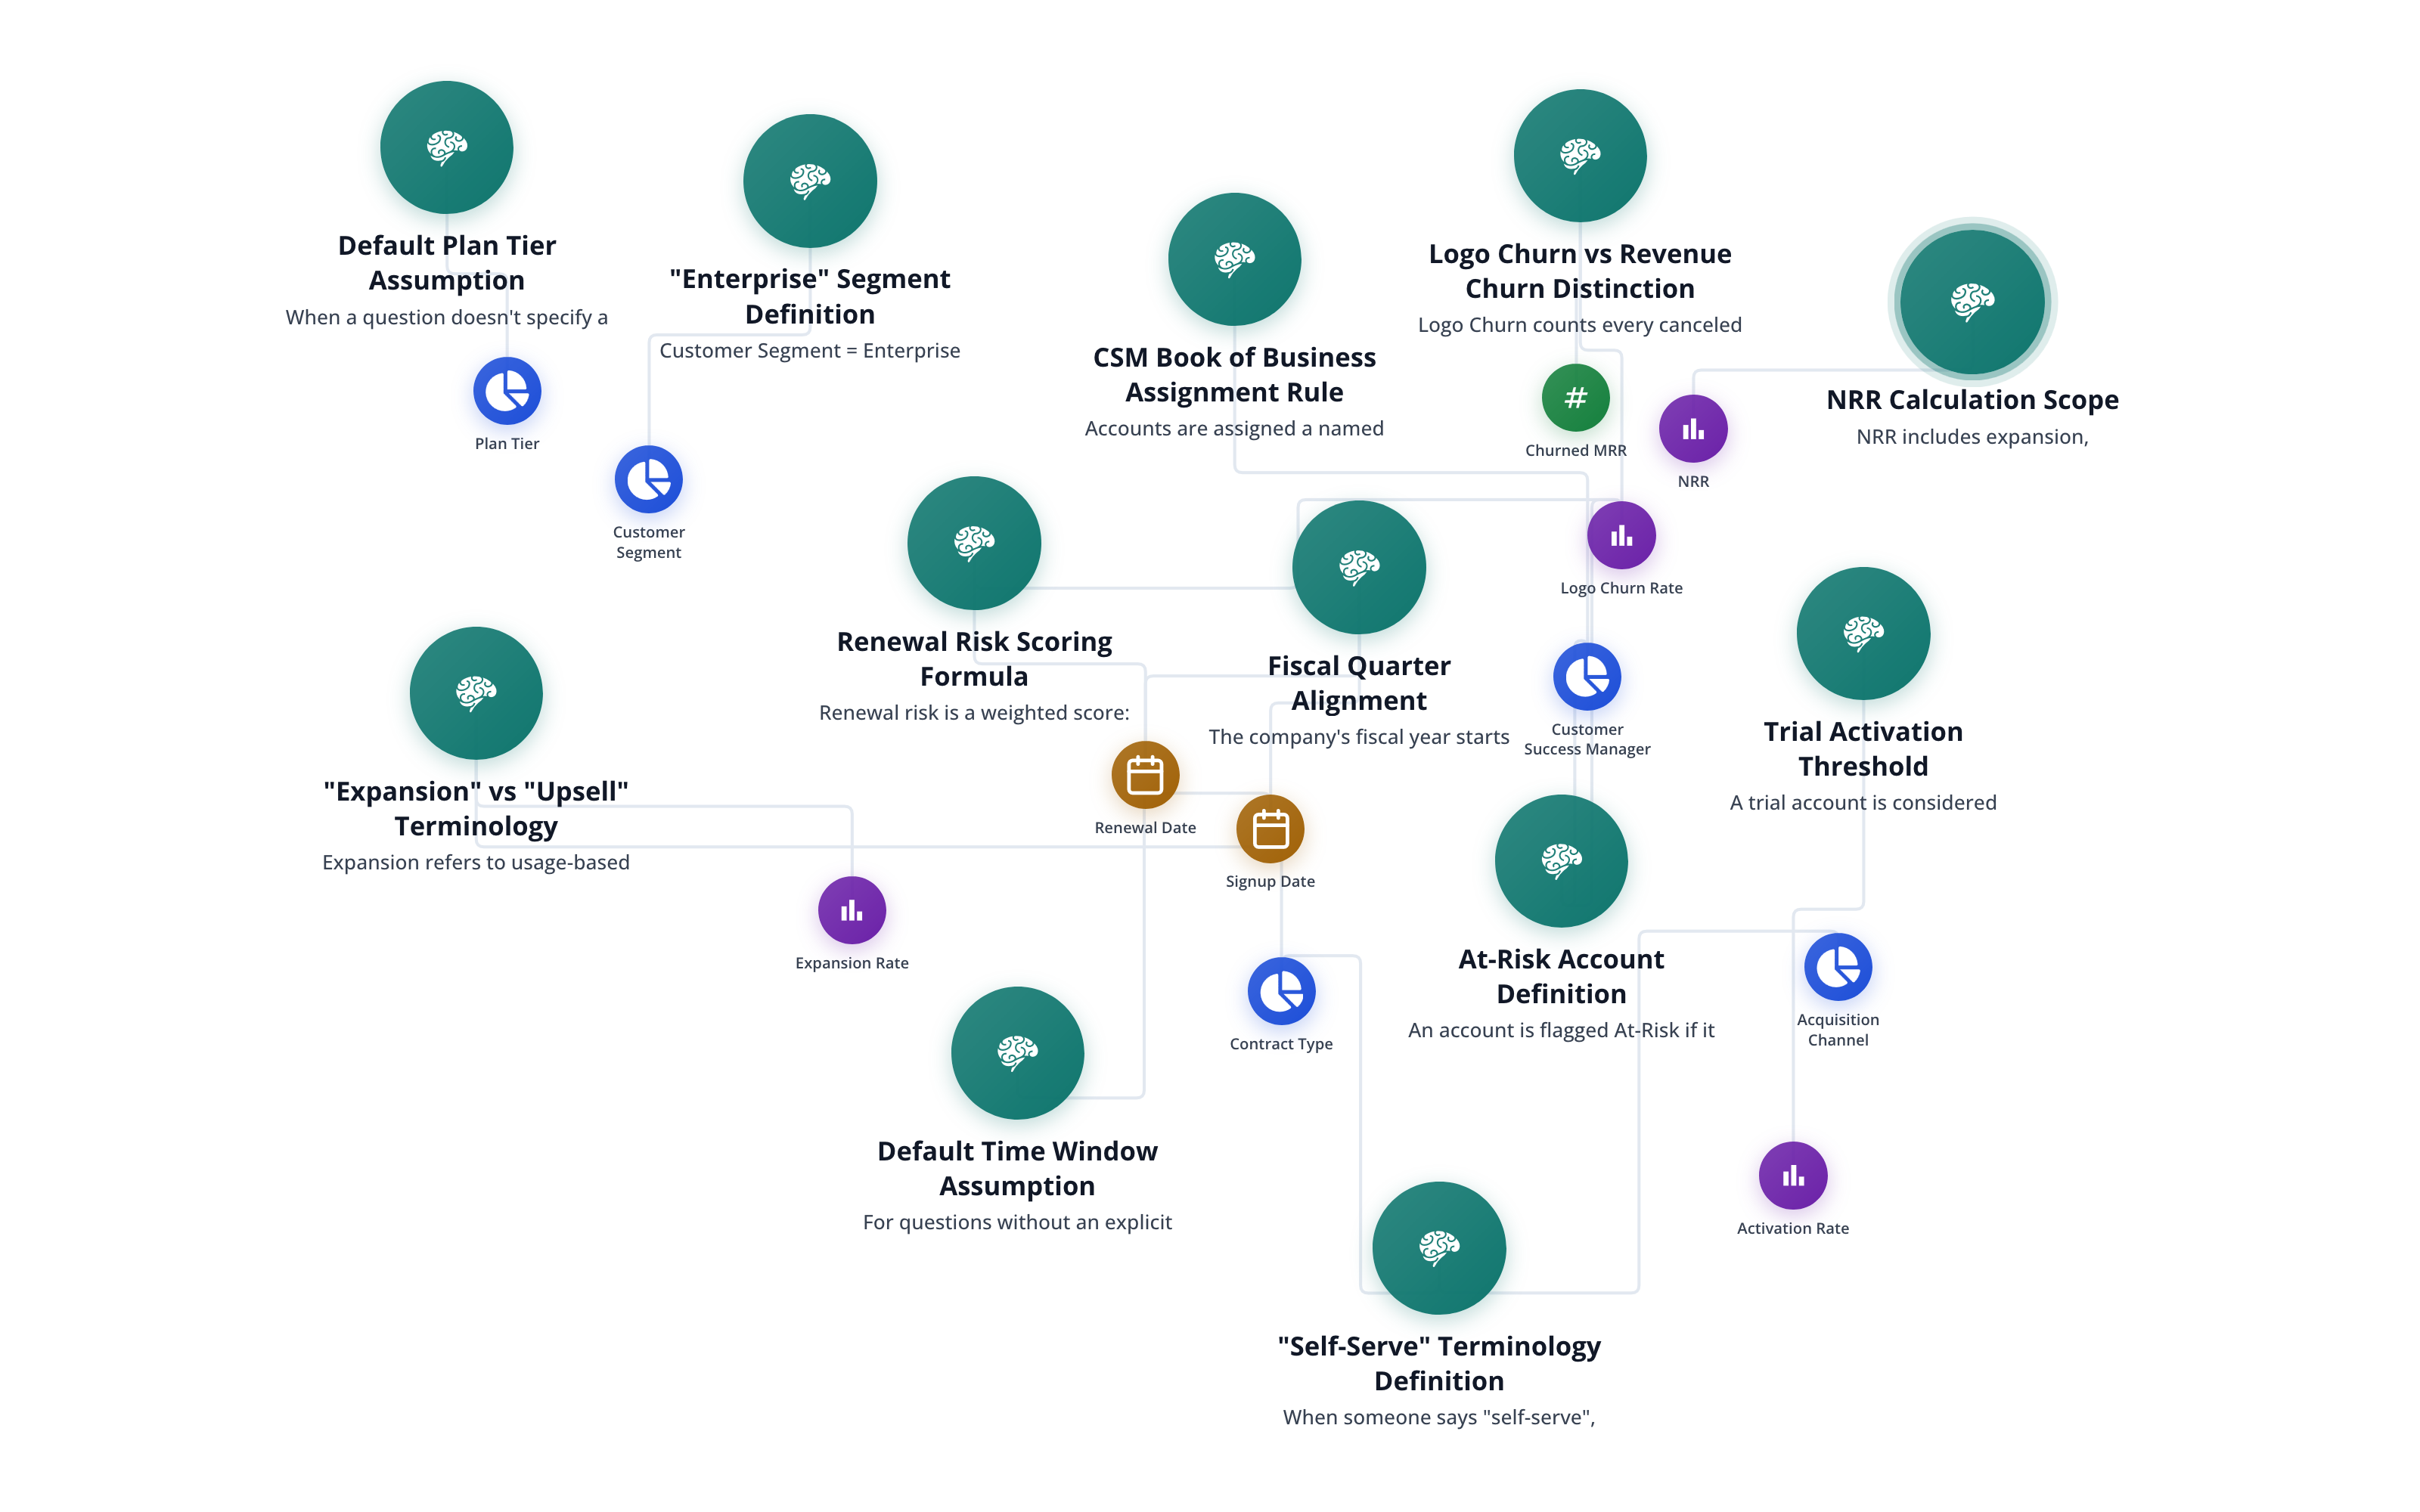
One analyst across product and GTM. Grounded in your definitions.
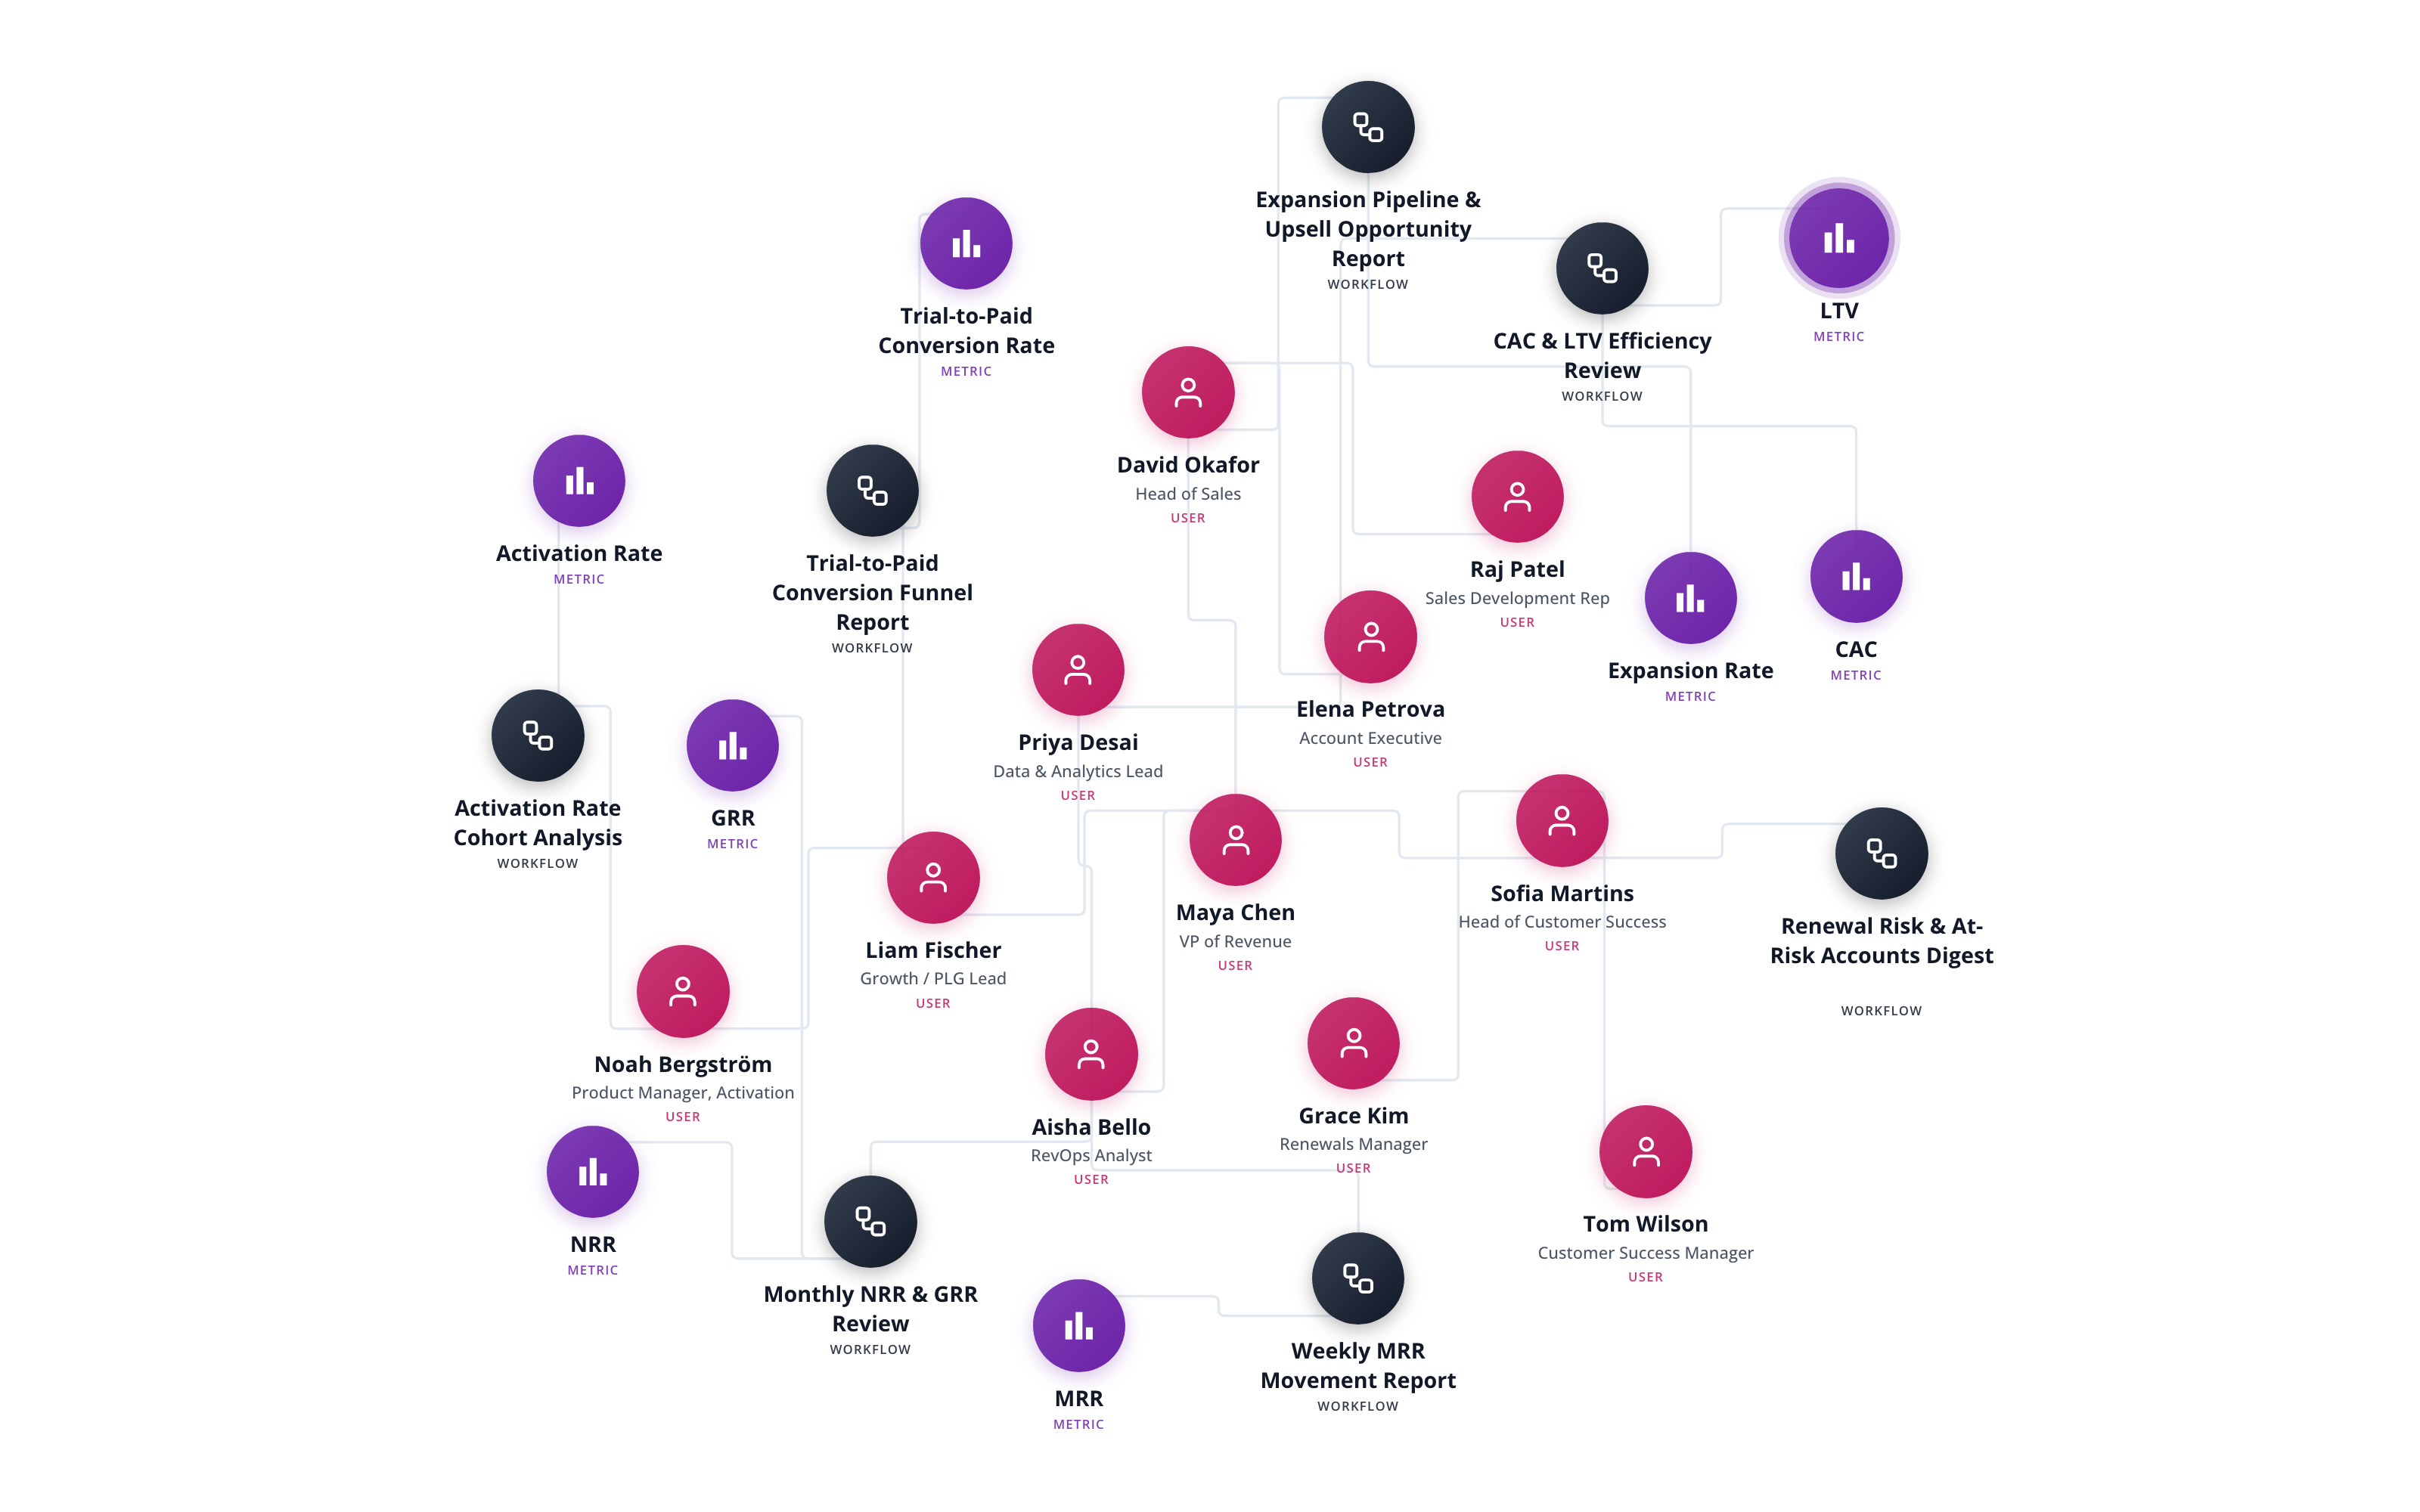
Your company generates enormous signals - product usage, pipeline velocity, expansion behavior. The value is in the intersections. Anko makes cross-functional questions answerable instantly, with answers your teams can trust and act on.
Request Demo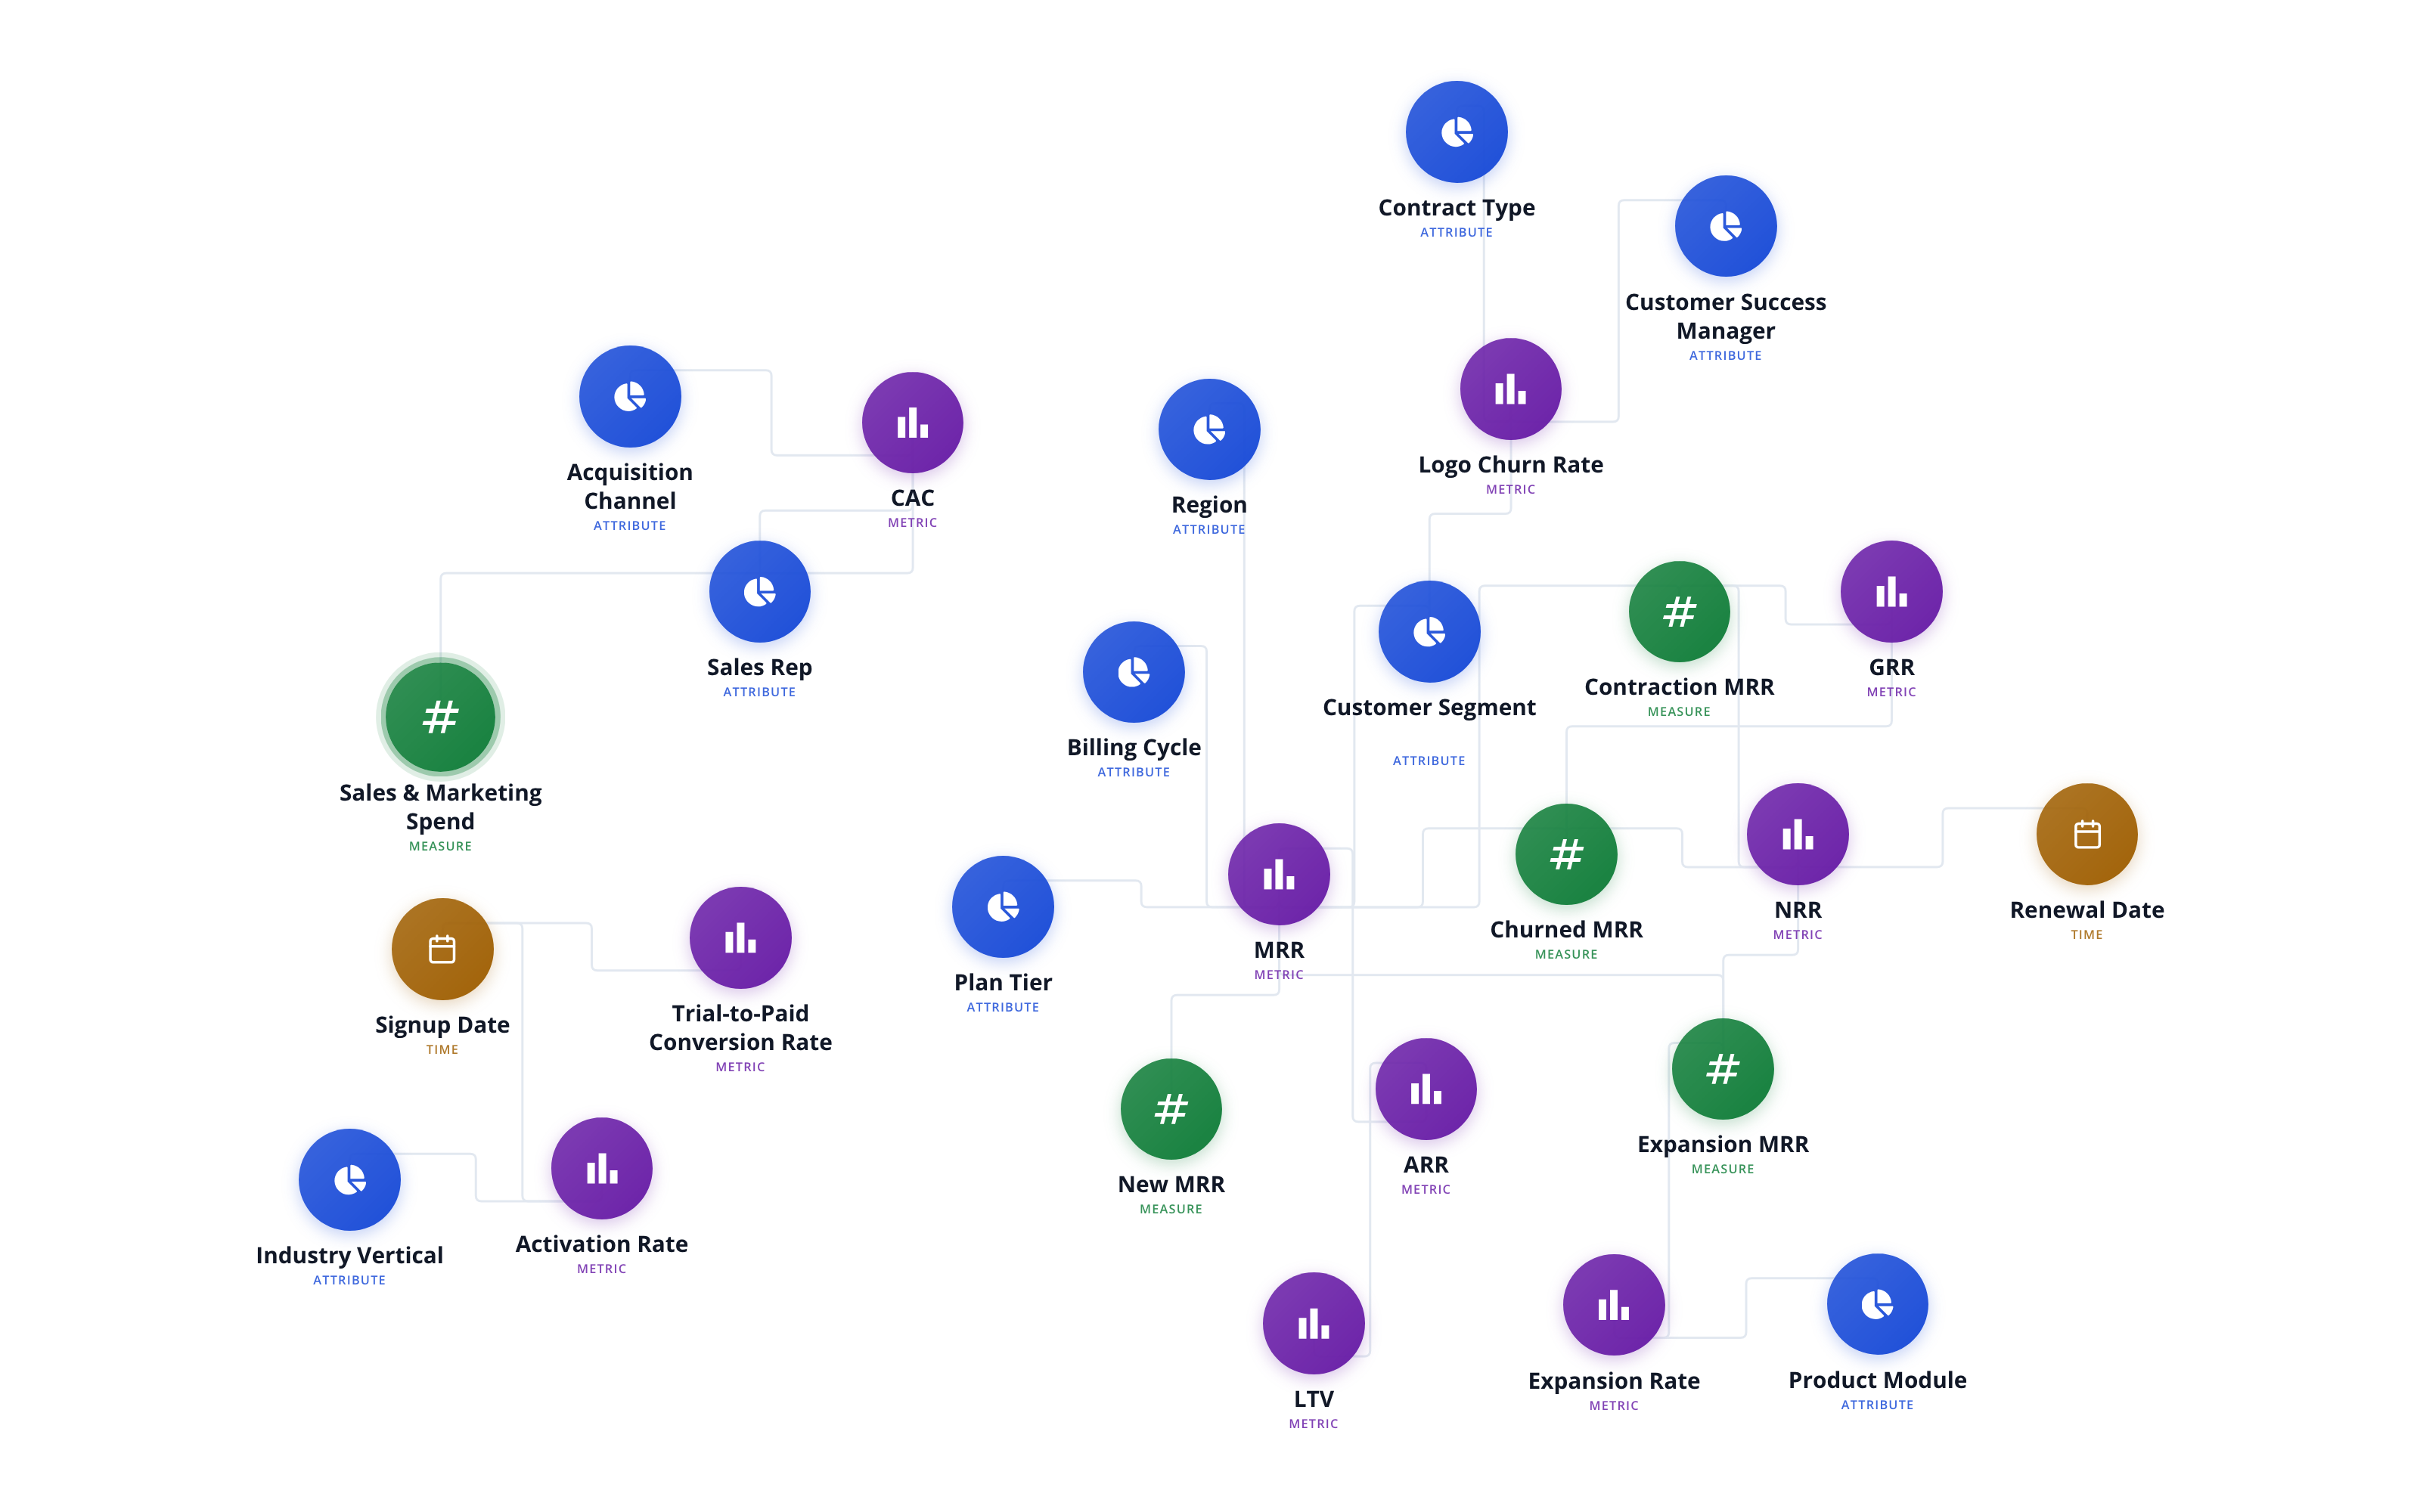
Surface the product signals that predict revenue.
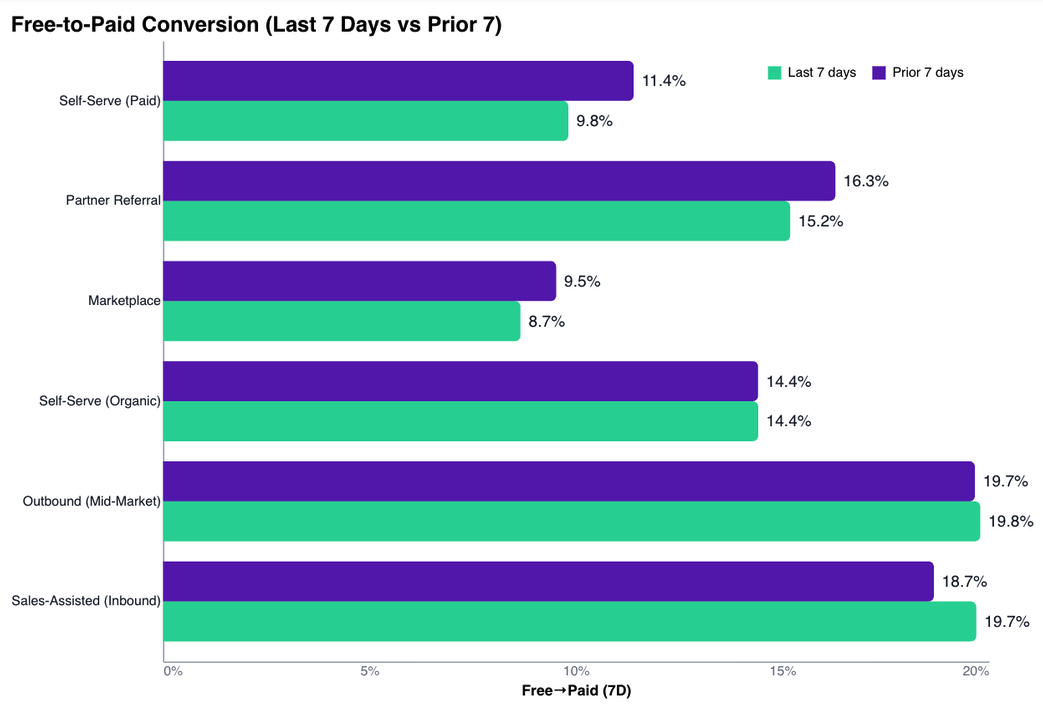
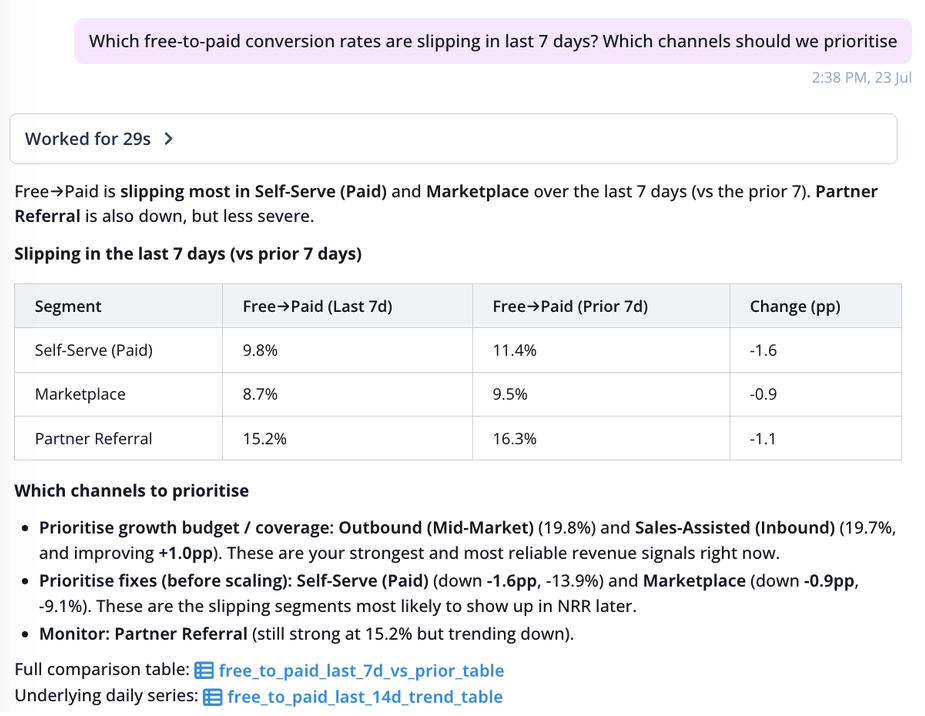
Which activation milestones correlate with retention? Which free-to-paid conversion rates are slipping? Anko connects product usage to revenue outcomes - surfacing the signals that matter to growth and CS teams before they show up in NRR.
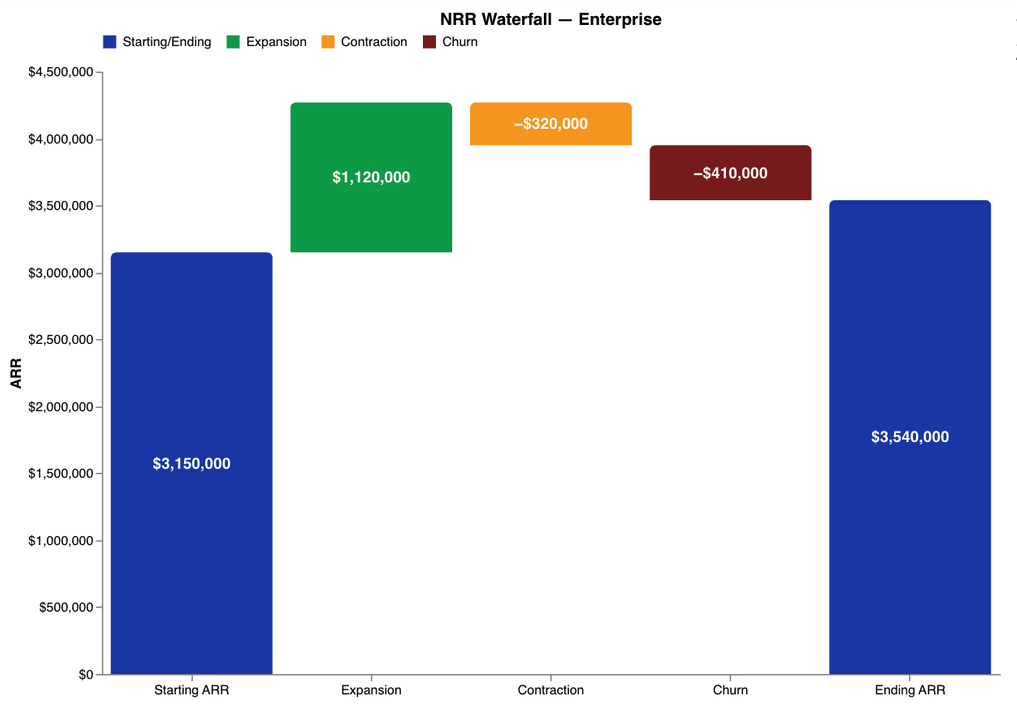
Decompose NRR into the numbers that actually matter.
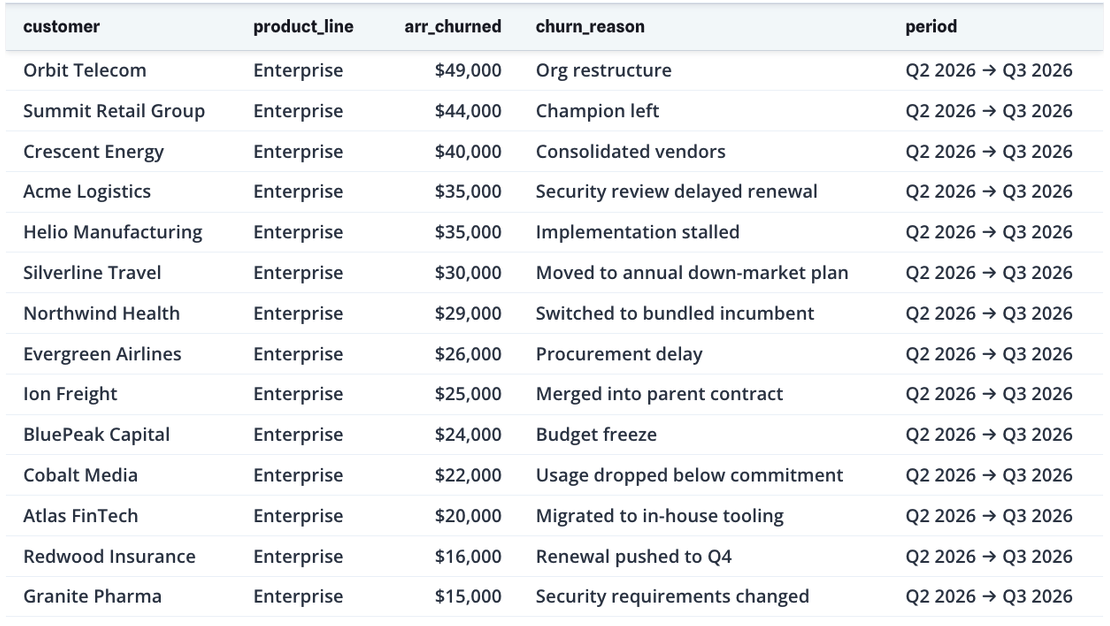
NRR is a single number that hides a lot. Anko breaks it down - expansion rate, contraction, churn, by cohort, segment, product line and tells you exactly where to focus.
Keep go-to-market efficiency visible in real time.
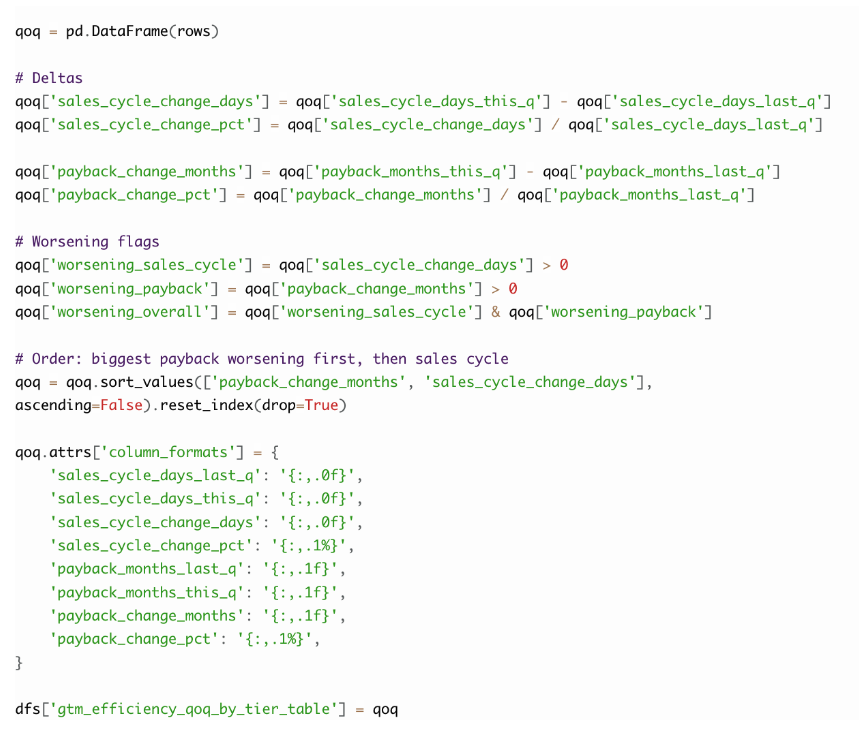
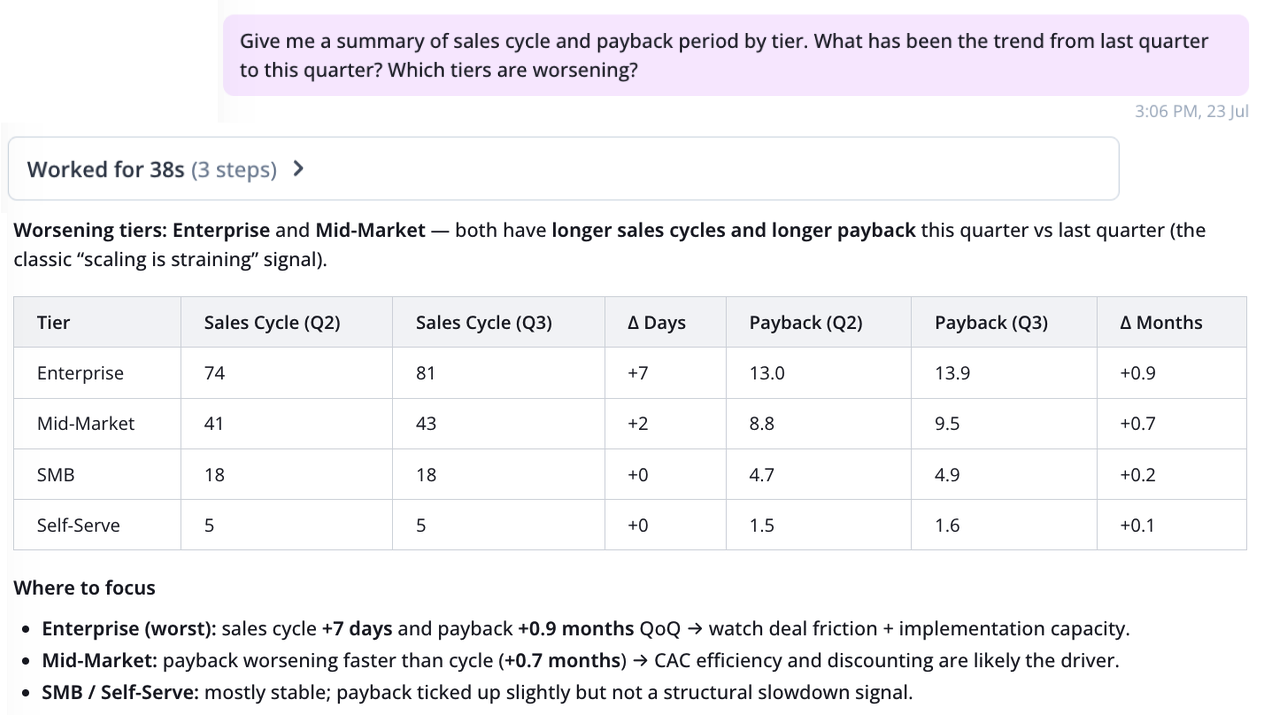
CAC by channel, sales cycle by segment, win rate by competitor, payback period by tier - Anko tracks the efficiency metrics that determine whether your GTM is scaling or straining, and surfaces the inflection points early.
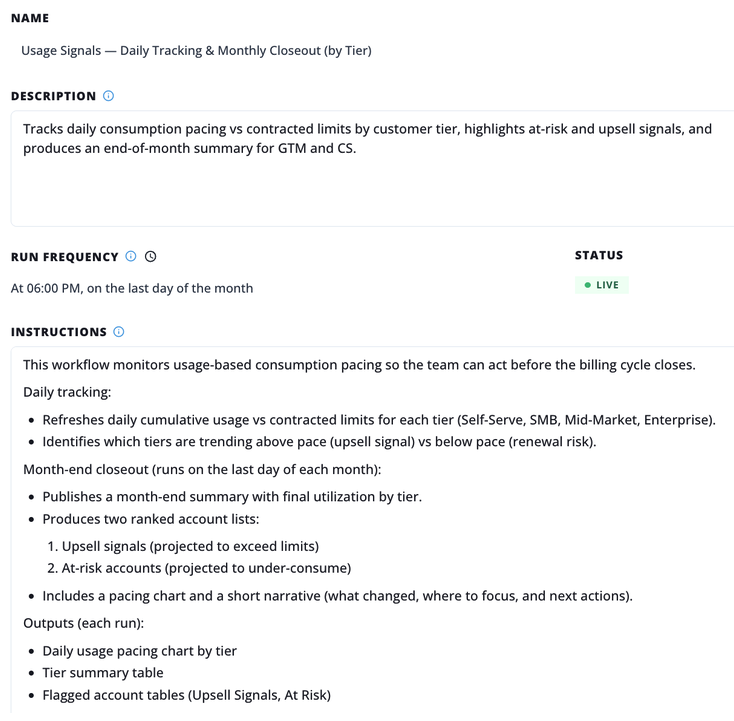
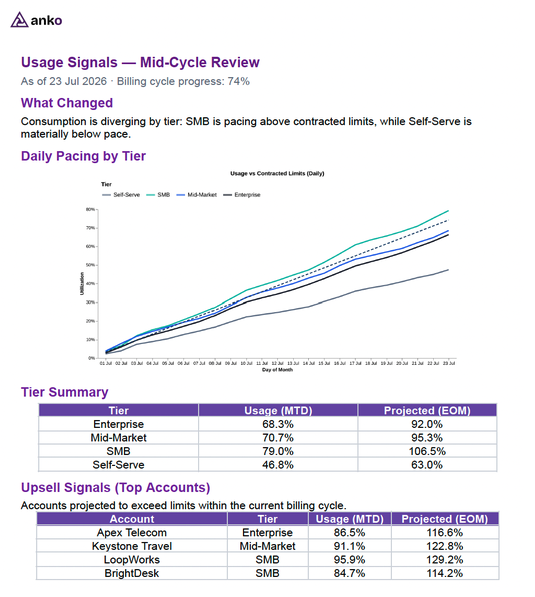
Monitor usage-based signals before the billing cycle closes.
For usage-based models, the risk and the opportunity both live in consumption data. Anko tracks usage against contracted limits continuously - flagging upsell signals and at-risk accounts with enough runway to act.